zoukankan      html  css  js  c++  java
  • ODOO引用Echarts数据展示

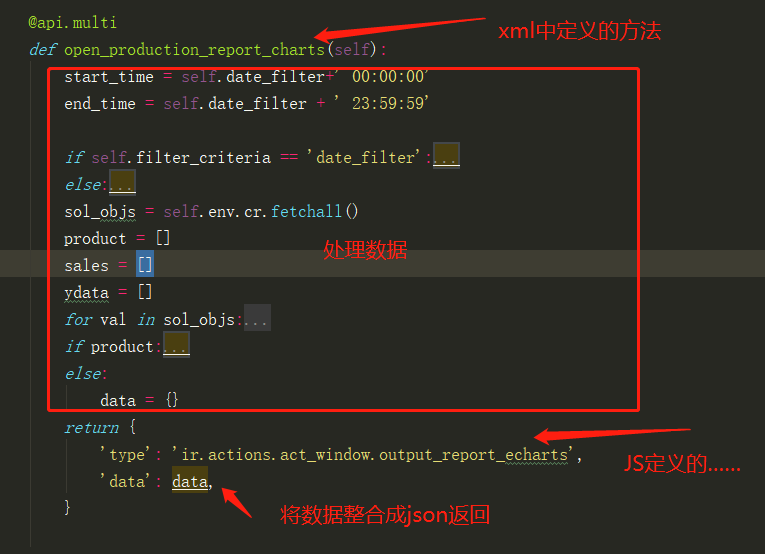
    作为一个后端开发,首先想到的是将需要的数据进行处理反馈给前端。

    具体如下:

    然后就是专门的echarts模块(我这样写主要是因为echarts会用到的地方比较多,后续直接调用)
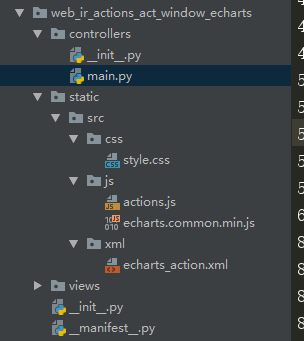
    1、

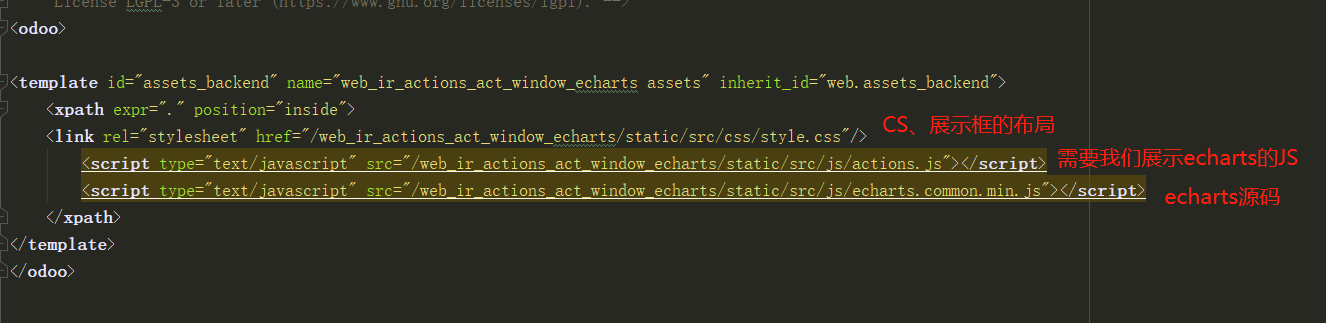
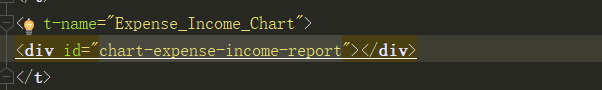
    2、echarts_action.xml

    3、actions.js

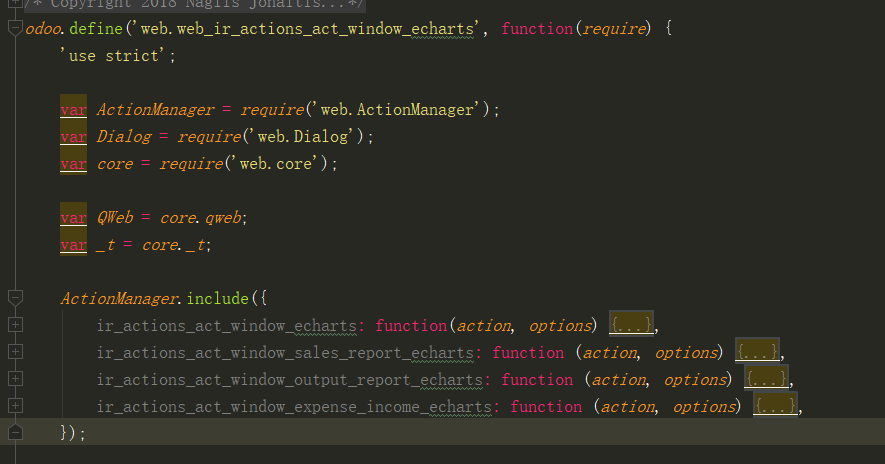
      1 ir_actions_act_window_expense_income_echarts: function (action, options) {
      2             var self = this;
      3             console.log(action)
      4             var dialog = new Dialog(
      5                 this,
      6                 _.extend({
      7                     $content: QWeb.render('Expense_Income_Chart', {
      8                         data: action.data,
      9                         help_text: action.help_text,
     10                         flags: action.flags,
     11                     }),
     12                     size: action.size || 'large',
     13                     title: action.name || _t('销售情况'),
     14                     buttons: [
     15                         {
     16                             text: _t('Close'),
     17                             close: true
     18                         }
     19                     ],
     20                 }, options)
     21             );
     22 
     23             dialog.opened().then(function () {
     24                 self._rpc({
     25                     route: '/web/sales_report_chart',
     26                     params: {
     27                         data: action.data
     28                     }
     29                 }).then(function (result) {
     30                     console.log(result)
     31                     var myChart = echarts.init(document.getElementById('chart-expense-income-report'));
     32 
     33                     var waterMarkText = 'ECHARTS';
     34                     var themeJson = result.hes_objs;
     35                     var canvas = document.createElement('canvas');
     36                     var ctx = canvas.getContext('2d');
     37                     canvas.width = canvas.height = 100;
     38                     ctx.textAlign = 'center';
     39                     ctx.textBaseline = 'middle';
     40                     ctx.globalAlpha = 0.08;
     41                     ctx.font = '20px Microsoft Yahei';
     42                     ctx.translate(50, 50);
     43                     ctx.rotate(-Math.PI / 4);
     44                     ctx.fillText(waterMarkText, 0, 0);
     45                     if (result.total_amount) {
     46                         var option = {
     47                         backgroundColor: {
     48                             type: 'pattern',
     49                             image: canvas,
     50                             repeat: 'repeat'
     51                         },
     52                         tooltip: {},
     53                         title: [{
     54                             text: result.title,
     55                             subtext: '总计: ' + result.sum_sales,
     56                             x: '25%',
     57                             textAlign: 'center'
     58                         },
     59                             {
     60                             text: '类型占比',
     61                             x: '75%',
     62                             textAlign: 'center'
     63                         }],
     64                         grid: [{
     65                             top: 100,
     66                              '70%',
     67                             bottom: '5%',
     68                             height: '80%',
     69                             left: 10,
     70                             containLabel: true
     71                         },],
     72                         xAxis: [{
     73                             type: 'category',
     74                             data: result.expense_name,
     75                             axisLabel: {
     76                                 interval: 0,
     77                             },
     78                             splitLine: {
     79                                 show: false
     80                             }
     81                         },],
     82                         yAxis: [{
     83                             type: 'value',
     84                             splitLine: {
     85                                 show: false
     86                             },
     87                             axisLabel: {
     88                                 interval: 0,
     89                                 rotate: 30,
     90                                 formatter: '{value} 元'
     91                             },
     92                         },],
     93                         series: [{
     94                             type: 'bar',
     95                             stack: 'chart',
     96                             z: 3,
     97                             label: {
     98                                 normal: {
     99                                     position: 'top',
    100                                     show: true
    101                                 }
    102                             },
    103                              itemStyle: {
    104                                         normal: {
    105                                             color: '#55A9AF'
    106                                         }
    107                                     },
    108                             data: result.total_amount
    109                         }, {
    110                             type: 'pie',
    111                             radius: [0, '30%'],
    112                             center: ['75%', '30%'],
    113                             data: Object.keys(themeJson).map(function (key) {
    114                                 return {
    115                                     name: key.replace('.js', ''),
    116                                     value: themeJson[key]
    117                                 }
    118                             }),
    119                             itemStyle: {
    120                                 emphasis: {
    121                                     shadowBlur: 10,
    122                                     shadowOffsetX: 0,
    123                                     shadowColor: 'rgba(0, 0, 0, 0.5)'
    124                                 }
    125                             }
    126                         }]
    127                     };
    128                     }
    129                     else {
    130                         var option = {
    131                             title: {
    132                                 text: "无数据!",
    133                             },
    134                         }
    135                     }
    136                     myChart.setOption(option);
    137                 }).fail(function (error, event) {
    138                     event.preventDefault();
    139                 }).always(function () {
    140                 });
    141             });
    142             return dialog.open();
    143         },
    js示例
  • 相关阅读:
    MVC5 Controller构造方法获取User为空解决方法
    js删除Array数组中的某个元素
    VS2015 工具箱 保存位置
    Mapper 赋值对应实体属性
    cookieHelper
    python3练习100题——007
    python3练习100题——006
    python3练习100题——005
    python3练习100题——004
    python3练习100题——003
  • 原文地址:https://www.cnblogs.com/yifugui/p/9661276.html
Copyright © 2011-2022 走看看