我们可以把loghub当作一个消息中间件来使用。如果能知道当前的消费进度,自然好了,否则消费情况一无所知,总是有点慌!
loghub消费分两种情况,一是普通消费,二是消费组消费;
消费组消费,loghub服务端会记录消费情况,这时可以通过调用服务端API进行偏移信息查询。
普通消费则不同,需要自行维护偏移量,即只有自己知道偏移信息,自己处理延迟。我们主要讨论这种情况。
一、 消费loghub数据的样例如下:
    // 普通消费
    private static void consumeDataFromShard(int shardId) throws Exception {
        String cursor = client.GetCursor(project, logStore, shardId, new Date()).GetCursor();
        System.out.println("cursor = " +cursor);
        try {
            while (true) {
                PullLogsRequest request = new PullLogsRequest(project, logStore, shardId, 1000, cursor);
                PullLogsResponse response = client.pullLogs(request);
                List<LogGroupData> logGroups = response.getLogGroups();
                if (logGroups.isEmpty()) {
                    return;
                }

                System.out.println(response.getCount());
                System.out.println("cursor = " + cursor + " next_cursor = " + response.getNextCursor());
                logGroups.forEach(rec1 -> {
                    // do your biz
                });
                cursor = response.getNextCursor();
                Thread.sleep(200);
            }
        }
        catch(LogException e) {
            System.out.println(e.GetRequestId() + e.GetErrorMessage());
        }
    }
因为消费一直在进行,想要进行监控,就插入一些埋点。我们可以使用的 Map 来保存每个 shard 的消费延迟情况。用一个 LoghubCursorDelayTransformer 描述具体信息。
    /**
     * 消费偏移控制容器
     */
    public static final ConcurrentMap<Integer, LoghubCursorDelayTransformer> CONSUME_CURSOR_DELAY_TRANSFORMER = new ConcurrentHashMap<>();

/**
 * loghub 分区延迟管理器
 *
 * @author weiy
 * @date 2019/11/27
 */
public class LoghubCursorDelayTransformer {
    /**
     * 最后一次消费 loghub 数据的时间(大约)
     */
    private int lastConsumeDataTime;

    /**
     * 消费延迟 (s)
     */
    private int delay;

    /**
     * 分区 shard
     */
    private int shard;

    /**
     * 记录创建时间,如果创建时间已很久,说明该消费延迟应已失效
     */
    private long recordTime = System.currentTimeMillis();

    public LoghubCursorDelayTransformer(int lastConsumeDataTime, int delay, int shard) {
        this.lastConsumeDataTime = lastConsumeDataTime;
        this.delay = delay;
        this.shard = shard;
    }

    public int getLastConsumeDataTime() {
        return lastConsumeDataTime;
    }

    public int getDelay() {
        return delay;
    }

    public int getShard() {
        return shard;
    }

    public long getRecordTime() {
        return recordTime;
    }

}
二、 埋点插入监控数据
只要在每次消费完成之后,进行一次消费延迟的记录就好了,具体记录可以视情况而定。比如,每消费一批次之后记录一次就是个不错的选择!
    private static void consumeDataFromShard(int shardId) throws Exception {
        String cursor = client.GetCursor(project, logStore, shardId, new Date()).GetCursor();
        System.out.println("cursor = " +cursor);
        try {
            while (true) {
                PullLogsRequest request = new PullLogsRequest(project, logStore, shardId, 1000, cursor);
                PullLogsResponse response = client.pullLogs(request);
                List<LogGroupData> logGroups = response.getLogGroups();
                if (logGroups.isEmpty()) {
                    // 没有更多数据,以当前系统时间作为最后消费时间(并不关心实际生产者是否有在产生旧数据)
                    metricConsumeDelay((int)(System.currentTimeMillis() / 1000), shardId, -1);
                    return;
                }

                System.out.println(response.getCount());
                System.out.println("cursor = " + cursor + " next_cursor = " + response.getNextCursor());
                logGroups.forEach(rec1 -> {
                    // do your biz
                });
                // 每批次消费完成后,记录一次消费延迟情况
                // 此处取 最后一个消息的时间作为批次时间点
                int lastestConsumeTime = logGroups.get(logGroups.size() -1).GetFastLogGroup().getLogs(0).getTime();
                metricConsumeDelay(lastestConsumeTime, shardId, null);
                cursor = response.getNextCursor();
                Thread.sleep(200);
            }
        }
        catch(LogException e) {
            System.out.println(e.GetRequestId() + e.GetErrorMessage());
        }
    }
    /**
     * 记录消费延迟信息
     *
     * @param lastConsumeTime 最后消费时间(如果没有获取到数据,则使用系统时间代替),单位为 s秒
     * @param shard 分区id
     * @param calculatedDelay 已计算好的延时,为null时需要根据当前系统时间计算
     */
    public static void metricConsumeDelay(int lastConsumeTime, int shard, Integer calculatedDelay) {
        if(calculatedDelay == null) {
            calculatedDelay = (int)(System.currentTimeMillis() / 1000) - lastConsumeTime;
        }
        LoghubCursorDelayTransformer delayTransformer = new LoghubCursorDelayTransformer(
                lastConsumeTime, calculatedDelay, shard);
        CONSUME_CURSOR_DELAY_TRANSFORMER.put(shard, delayTransformer);
    }
如上的延迟统计是不准确的,如果想准确统计,应使用 cursor 与 最后的偏移进行对比才行。如下:
    private static void consumeDataFromShard(int shardId) throws Exception {
        String cursor = client.GetCursor(project, logStore, shardId, new Date()).GetCursor();
        System.out.println("cursor = " +cursor);
        try {
            while (true) {
                PullLogsRequest request = new PullLogsRequest(project, logStore, shardId, 1000, cursor);
                PullLogsResponse response = client.pullLogs(request);
                List<LogGroupData> logGroups = response.getLogGroups();
                if (logGroups.isEmpty()) {
                    // 没有更多数据,以当前系统时间作为最后消费时间(并不关心实际生产者是否有在产生旧数据)
                    metricConsumeDelay((int)(System.currentTimeMillis() / 1000), shardId, -1);
                    return;
                }

                System.out.println(response.getCount());
                System.out.println("cursor = " + cursor + " next_cursor = " + response.getNextCursor());
                logGroups.forEach(rec1 -> {
                    // do your biz
                });
                cursor = response.getNextCursor();
                // 从loghub-api 换取具体时间,计算延迟,可能会导致性能下降厉害
                int lastestConsumeTime = exchangeTimeWithCursorFromApi(cursor, shardId);
                int delay = getMaxTimeOffsetFromApi(shardId) - lastestConsumeTime;
                metricConsumeDelay(lastestConsumeTime, shardId, delay);
                Thread.sleep(200);
            }
        }
        catch(LogException e) {
            System.out.println(e.GetRequestId() + e.GetErrorMessage());
        }
    }

    /**
     * 从loghub-api中获取对应cursor的时间
     *
     * @param cursor 指定游标(当前)
     * @param shardId 分区id
     * @return 数据时间
     * @throws LogException 查询异常时抛出
     */
    public static int exchangeTimeWithCursorFromApi(String cursor, int shardId) throws LogException {
        GetCursorTimeResponse cursorTimeResponse = client.GetCursorTime(project, logStore, shardId, cursor);
        return cursorTimeResponse.GetCursorTime();
    }

    /**
     * 从loghub-api中获取最大的时间偏移,以便精确计算消费延迟
     *
     * @param shardId 分区id
     * @return 最大时间
     * @throws LogException 查询异常时抛出
     */
    public static int getMaxTimeOffsetFromApi(int shardId) throws LogException {
        String cursor = client.GetCursor(project, logStore, shardId, Consts.CursorMode.END).GetCursor();
        return exchangeTimeWithCursorFromApi(cursor, shardId);
    }
三、 监控数据暴露
通过prometheus进行数据暴露!
    /**
     * 暴露延迟信息数据,启动时调用即可
     */
    public static void exposeMetricData() {
        // 统计loghub消费延时
        CollectorRegistry.defaultRegistry.register(new Collector() {
            @Override
            public List<MetricFamilySamples> collect() {
                List<MetricFamilySamples> mfs = new ArrayList<>();
                final ConcurrentMap<Integer, LoghubCursorDelayTransformer> cursorHolder = CONSUME_CURSOR_DELAY_TRANSFORMER;
                // With lastest time labels
                GaugeMetricFamily consumeTimeGauge = new GaugeMetricFamily("my_shard_consume_lastest",
                        "last consume time watch help",
                        Collections.singletonList("shard"));
                // With delay labels
                GaugeMetricFamily delayGauge = new GaugeMetricFamily("my_shard_consume_delay",
                        "delay msg help",
                        Collections.singletonList("shard"));
                // todo: 注意优化消费长时间暂停情况
                for (LoghubCursorDelayTransformer delayTransformer : cursorHolder.values()) {
                    delayGauge.addMetric(
                            Collections.singletonList(delayTransformer.getShard() + ""),
                            delayTransformer.getDelay());
                    consumeTimeGauge.addMetric(Collections.singletonList("" + delayTransformer.getShard()), delayTransformer.getLastConsumeDataTime());
                }

                mfs.add(delayGauge);
                mfs.add(consumeTimeGauge);
                return mfs;
            }

        });
    }
是不是很简单?自定义一个 Collector 就可以了。接入信息的其他细节可以参考之前的文章。
四、 消费组的监控?
消费端实践
    private static String sEndpoint = "cn-hangzhou.log.aliyuncs.com";
    private static String sProject = "ali-cn-hangzhou-sls-admin";
    private static String sLogstore = "sls_operation_log";
    private static String sConsumerGroup = "consumerGroupX";
    private static String sAccessKeyId = "";
    private static String sAccessKey = "";
    public static void groupConsume() throws LogHubClientWorkerException, InterruptedException {
        // 第二个参数是消费者名称,同一个消费组下面的消费者名称必须不同,可以使用相同的消费组名称,不同的消费者名称在多台机器上启动多个进程,来均衡消费一个Logstore,这个时候消费者名称可以使用机器ip来区分。第9个参数(maxFetchLogGroupSize)是每次从服务端获取的LogGroup数目,使用默认值即可,如有调整请注意取值范围(0,1000]。
        LogHubConfig config = new LogHubConfig(sConsumerGroup, "consumer_1", sEndpoint, sProject, sLogstore, sAccessKeyId, sAccessKey, LogHubConfig.ConsumePosition.BEGIN_CURSOR);
        ClientWorker worker = new ClientWorker(new SampleLogHubProcessorFactory(), config);
        Thread thread = new Thread(worker);
        //Thread运行之后,Client Worker会自动运行,ClientWorker扩展了Runnable接口。
        thread.start();
        Thread.sleep(60 * 60 * 1000);
        //调用worker的Shutdown函数,退出消费实例,关联的线程也会自动停止。
        worker.shutdown();
        //ClientWorker运行过程中会生成多个异步的Task,Shutdown之后最好等待还在执行的Task安全退出,建议sleep 30s。
        Thread.sleep(30 * 1000);
    }
// 消费业务端样例
public class SampleLogHubProcessor implements ILogHubProcessor {
    private int shardId;
    // 记录上次持久化 checkpoint 的时间。
    private long mLastCheckTime = 0;

    public void initialize(int shardId) {
        this.shardId = shardId;
    }

    // 消费数据的主逻辑,这里面的所有异常都需要捕获,不能抛出去。
    public String process(List<LogGroupData> logGroups,
                          ILogHubCheckPointTracker checkPointTracker) {
        // 这里简单的将获取到的数据打印出来。
        for (LogGroupData logGroup : logGroups) {
            FastLogGroup flg = logGroup.GetFastLogGroup();
            System.out.println(String.format("	category	:	%s
	source	:	%s
	topic	:	%s
	machineUUID	:	%s",
                    flg.getCategory(), flg.getSource(), flg.getTopic(), flg.getMachineUUID()));
            System.out.println("Tags");
            for (int tagIdx = 0; tagIdx < flg.getLogTagsCount(); ++tagIdx) {
                FastLogTag logtag = flg.getLogTags(tagIdx);
                System.out.println(String.format("	%s	:	%s", logtag.getKey(), logtag.getValue()));
            }
            for (int lIdx = 0; lIdx < flg.getLogsCount(); ++lIdx) {
                FastLog log = flg.getLogs(lIdx);
                System.out.println("--------
Log: " + lIdx + ", time: " + log.getTime() + ", GetContentCount: " + log.getContentsCount());
                for (int cIdx = 0; cIdx < log.getContentsCount(); ++cIdx) {
                    FastLogContent content = log.getContents(cIdx);
                    System.out.println(content.getKey() + "	:	" + content.getValue());
                }
            }
        }
        long curTime = System.currentTimeMillis();
        // 每隔 30 秒,写一次 checkpoint 到服务端,如果 30 秒内,worker crash,
        // 新启动的 worker 会从上一个 checkpoint 取消费数据,有可能有少量的重复数据。
        if (curTime - mLastCheckTime > 30 * 1000) {
            try {
                //参数true表示立即将checkpoint更新到服务端,为false会将checkpoint缓存在本地,后台默认隔60s会将checkpoint刷新到服务端。
                checkPointTracker.saveCheckPoint(true);
            } catch (LogHubCheckPointException e) {
                e.printStackTrace();
            }
            mLastCheckTime = curTime;
        }
        return null;
    }

    // 当 worker 退出的时候,会调用该函数,用户可以在此处做些清理工作。
    public void shutdown(ILogHubCheckPointTracker checkPointTracker) {
        //将消费断点保存到服务端。
        try {
            checkPointTracker.saveCheckPoint(true);
        } catch (LogHubCheckPointException e) {
            e.printStackTrace();
        }
    }
}

class SampleLogHubProcessorFactory implements ILogHubProcessorFactory {
    public ILogHubProcessor generatorProcessor() {
        // 生成一个消费实例。
        return new SampleLogHubProcessor();
    }
}
实现原理即定期向loghub中写入 checkpoint, 以便可以查询。既然数据都写入了 loghub 服务端,那么也能很容易在后台看到消费延迟了。
不过我们也可以通过api获取消费情况,自行另外监控也行。(只是意义不大)
可以通过如下方式获取当前消费情况,与最后的数据偏移做比较,就可以得到延迟情况了。
List<ConsumerGroupShardCheckPoint> checkPoints = client.GetCheckPoint(project, sLogstore, sConsumerGroup).getCheckPoints();
五、 grafana 延迟监控配置
前面通过prometheus获取到了延迟数据,接入到grafana后,就可以进行展示了。我们先来看下最终效果!
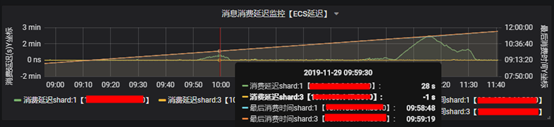
配置本身是很简单的,有个注意的点是需要整合两个坐标数据,因为一个消费延迟数据,另一个是具体的消费时间,这样就可以同步查看了。
配置右边的Y轴坐标需要使用 series override 选项,使用正则进行匹配如: /最后消费时间shard:.*/i
时间选项需要乘以1000变为毫秒如: test_shard_consume_lastest * 1000
监控思路可以扩展到以拉取模式进行消费的消息系统。