前言:
在一般运维工作中经常会遇到这么一个场景,服务器的IO负载很高(iostat中的util),但是无法快速的定位到IO负载的来源进程和来源文件导致无法进行相应的策略来解决问题。
这个现象在MySQL上更为常见,在5.6(performance_schema提供io instrument)之前,我们通常只能猜到是MySQL导致的高IO,但是没法定位具体是哪个文件带来的负载。
例如是ibdata的刷写?还是冷门ibd的随机读取?
本文就将介绍一个比较简单的定位IO高负载的流程。
工具准备:
iotop: http://guichaz.free.fr/iotop/
pt-ioprofile:http://www.percona.com/downloads/percona-toolkit/2.2.1/
Step1 : iostat 查看IO情况
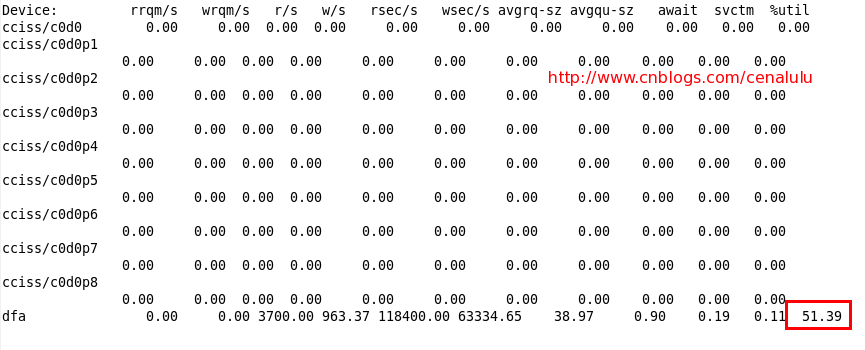
iostat -x 1 查看IO情况,从下图可以看到dfa这个磁盘的IO负载较高,接下来我们就来定位具体的负载来源
Step2: iotop定位负载来源进程
iotop的本质是一个python脚本,从proc中获取thread的IO信息,进行汇总。
执行命令:
/usr/bin/python2.6 /usr/bin/iotop -o
sudo /usr/bin/python2.6 /usr/bin/iotop -o
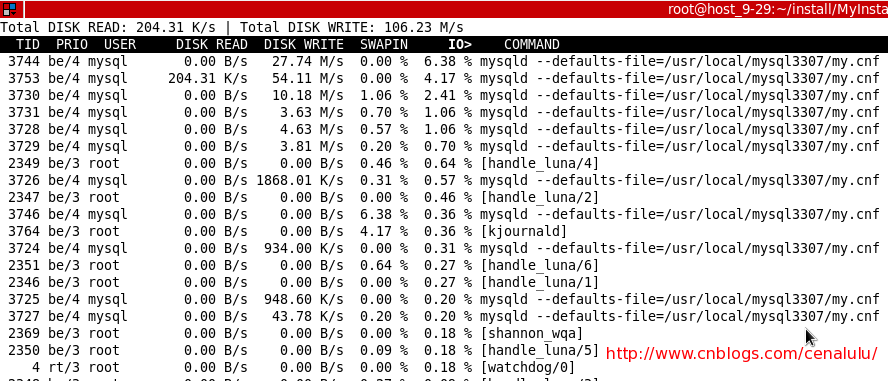
从下图可以看出大部分的IO来源都来自于mysqld进程。因此可以确定dfa的负载来源是数据库
Step3 pt-ioprofile定位负载来源文件
pt-ioprofile的原理是对某个pid附加一个strace进程进行IO分析。
以下是摘自官网的一段警示:
However, it works by attaching strace to the process using ptrace(), which will make it run very slowly until strace detaches. In addition to freezing the server, there is also some risk of the process crashing or performing badly after strace detaches from it, or indeed of strace not detaching cleanly and leaving the process in a sleeping state. As a result, this should be considered an intrusive tool, and should not be used on production servers unless you are comfortable with that.
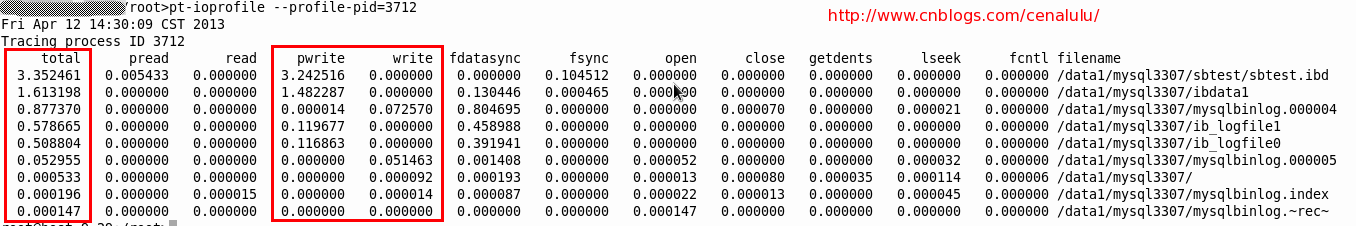
通过ps aux|grep mysqld 找到 mysqld进程对应的进程号,通过pt-ioprofile查看哪个文件的IO占用时间最多。
默认参数下该工具展示的是IO占用的时间。
对于定位问题更有用的是通过IO的吞吐量来进行定位。使用参数 --cell=sizes,该参数将结果已 B/s 的方式展示出来
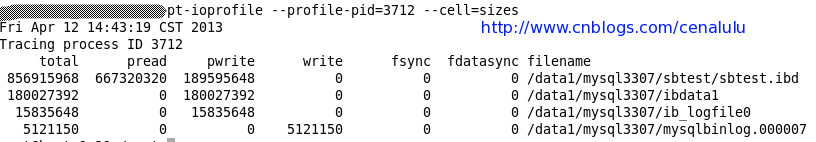
从上图可以看出IO负载的主要来源是sbtest (sysbench的IO bound OLTP测试)。
并且压力主要集中在读取上。