spring boot Actuator
Actuator概述
Actuator指的是负责和移动装置的组件。通过Actuator暴露的端点我们可以获取一个正在运行中的应用内部的状态
导入依赖
        <dependency>
            <groupId>org.springframework.boot</groupId>
            <artifactId>spring-boot-starter-actuator</artifactId>
        </dependency>
Actuator具备一些开箱即用的端口
| Endpoints id | 描述 | HTTP方法 | 是否敏感信息 |
|---|---|---|---|
| auditevents | 显示当前应用程序的审计事件信息 | GET | Yes |
| beans | 显示应用上下文中创建的所有Bean | GET | Yes |
| caches | 显示可用缓存信息 | GET | Yes |
| conditions | 显示自动装配类的状态及及应用信息 | GET | Yes |
| configprops | 显示所有 @ConfigurationProperties 列表 | GET | Yes |
| env | 显示 ConfigurableEnvironment 中的属性 | GET | Yes |
| flyway | 显示 Flyway 数据库迁移信息 | GET | Yes |
| health | 显示应用的健康信息(未认证只显示status,认证显示全部信息详情) | GET | No |
| info | 显示任意的应用信息(在资源文件写info.xxx即可) | GET | No |
| liquibase | 展示Liquibase 数据库迁移 | GET | Yes |
| metrics | 提供应用运行状态的完整度量指标报告 | GET | Yes |
| mappings | 显示所有 @RequestMapping 路径集列表 | GET | Yes |
| scheduledtasks | 显示应用程序中的计划任务 | GET | Yes |
| sessions | 允许从Spring会话支持的会话存储中检索和删除用户会话。 | GET | Yes |
| shutdown | 允许应用以优雅的方式关闭(默认情况下不启用) | POST | Yes |
| threaddump | 执行一个线程dump | GET | Yes |
| httptrace | 显示HTTP跟踪信息(默认显示最后100个HTTP请求 - 响应交换) | GET | Yes |
除了基于Http的端点之外,表中的所有除"/heapdump"的其他端点都以 JMX MBean的形式对外暴露出来
配置Actuator的基础路径
Actuator的前缀可以通过以下设置来进行更改
management:
  endpoints:
    web:
      base-path: /message
这样我们只需要向"/message/health"发送请求
启用和禁用端点
--- 启用所有端点
management:
  endpoints:
    web:
      exposure:
        include: "*"

--- 禁用指定端点
management:
  endpoints:
    web:
      exposure:
        exclude: health,info,beans
消费Actuator端点
为了了解Actuator提供了哪些端点,我们可以向Actuator发送一个get请求
{
  "_links": {
    "self": {
      "href": "http://localhost:8888/actuator",
      "templated": false
    },
    "archaius": {
      "href": "http://localhost:8888/actuator/archaius",
      "templated": false
    },
    "beans": {
      "href": "http://localhost:8888/actuator/beans",
      "templated": false
    },
    "caches-cache": {
      "href": "http://localhost:8888/actuator/caches/{cache}",
      "templated": true
    },
    "caches": {
      "href": "http://localhost:8888/actuator/caches",
      "templated": false
    },
    "health": {
      "href": "http://localhost:8888/actuator/health",
      "templated": false
    },
    "health-path": {
      "href": "http://localhost:8888/actuator/health/{*path}",
      "templated": true
    },
    "info": {
      "href": "http://localhost:8888/actuator/info",
      "templated": false
    },
    "conditions": {
      "href": "http://localhost:8888/actuator/conditions",
      "templated": false
    },
    "configprops": {
      "href": "http://localhost:8888/actuator/configprops",
      "templated": false
    }
      --------------
获取应用基本信息
"/info"告送我们关于应用的信息,"/health"端点则告送我们应用健康状况的信息。
请求应用信息 "/info"
$ curl localhost:8888/actuator/info
{}
发现并没有信息
我们可以通过配置文件基于infodua端点设置配置信息
info:
  contact:
    email: 1589391440@qq.com
    phone: 15684389579
再次发送请求
{
  "contact": {
    "email": "1589391440@qq.com",
    "phone": 15684389579
  }
}
应用健康情况
发送"/health"请求会得到一个简单的"/info"响应,其中包含了应用的健康状态。例如,如下是我们使用curl访问的结果
{"status":"up"}
这里显示的是一个或多个健康指示器的聚合状态。健康指示器会报告应用要与之交互的外部系统的健康状态,比如数据库、消息代理甚至SPring Cloud组件,比如Eureka和Config Server。每个指示器的健康状态可能会是下面的一个:
- UP:外部系统已经启动并且可以访问
- DOWN: 外部系统已经停机或者不可访问
- UNKNOWN: 外部系统的状态尚不清楚
- OUT_OF_SERVICE: 外部系统可以访问得到,但是目前不可用
所有健康指示器的状态会聚合成应用整体的健康状态,这个过程中会使用如下规则:
- UNKNOWN 的健康状态会被忽略,不会计入应用的聚合状态中。
- 其他的和单个指示器状态一样
默认情况下,只会包含聚合状态。但是我们可以设置
management:
  endpoint:
    health:
      show-details: always  # 默认值为never
always:总会显示健康状态器的完整细节; when-authorized,只有当客户端是完整认证的情况下才展示完整的细节信息
再次发送请求
{
  "status": "UP",
  "components": {
    "discoveryComposite": {
      "status": "UP",
      "components": {
        "discoveryClient": {
          "status": "UP",
          "details": {
            "services": [

            ]
          }
        },
        "eureka": {
          "description": "Eureka discovery client has not yet successfully connected to a Eureka server",
          "status": "UP",
          "details": {
            "applications": {

            }
          }
        }
      }
    },
  ---------------------------
其中有一个针对文件系统的健康指示器,名为diskSpace。它可以显示文件系统的状态情况,这个状态的值是由还有多少剩余空间绝定的。
查看配置细节
获取bean的装配报告
要研究Spring应用上下文,最基础的端点就是"/beans"。这个端点返回Json文档描述了应用上下文中的每个bean
{
  "contexts": {
    "application-1": {
      "beans": {
        "discoveryClientHealthIndicator": {
          "aliases": [

          ],
          "scope": "singleton",
          "type": "org.springframework.cloud.client.discovery.health.DiscoveryClientHealthIndicator",
          "resource": "class path resource [org/springframework/cloud/client/CommonsClientAutoConfiguration$DiscoveryLoadBalancerConfiguration.class]",
          "dependencies": [
            "org.springframework.cloud.client.CommonsClientAutoConfiguration$DiscoveryLoadBalancerConfiguration",
            "spring.cloud.discovery.client.health-indicator-org.springframework.cloud.client.discovery.health.DiscoveryClientHealthIndicatorProperties"
          ]
        },
        "org.springframework.cloud.netflix.eureka.EurekaClientAutoConfiguration$RefreshableEurekaClientConfiguration": {
          "aliases": [

          ],
          "scope": "singleton",
          "type": "org.springframework.cloud.netflix.eureka.EurekaClientAutoConfiguration$RefreshableEurekaClientConfiguration",
          "resource": null,
          "dependencies": [
            "discoveryClientOptionalArgs"
          ]
        },
        "inetUtils": {
          "aliases": [

          ],
          "scope": "singleton",
          "type": "org.springframework.cloud.commons.util.InetUtils",
          "resource": "class path resource [org/springframework/cloud/commons/util/UtilAutoConfiguration.class]",
          "dependencies": [
            "org.springframework.cloud.commons.util.UtilAutoConfiguration",
            "inetUtilsProperties"
          ]
        },

 -------------------------
响应的根元素是contexts,它包含了一个子元素,代表应用中的每个Spring应用上下文。在每个应用上下文中,都有一个beans元素,它包含了应用上下文所有bean的细节。
- 自动装配
可以向"/conditions"端点发送自动装配报告 其中分为3部分: 匹配上的(positive matches,即已通过的条件化配置)、未配置上的(negative matches,即失败的条件化配置)以及非条件化的类。
{
  "contexts": {
    "application-1": {
      "positiveMatches": {
        "AuditEventsEndpointAutoConfiguration": [
          {
            "condition": "OnAvailableEndpointCondition",
            "message": "@ConditionalOnAvailableEndpoint no property management.endpoint.auditevents.enabled found so using endpoint default; @ConditionalOnAvailableEndpoint marked as exposed by a 'management.endpoints.jmx.exposure' property"
          }
        ],
        "BeansEndpointAutoConfiguration": [
          {
            "condition": "OnAvailableEndpointCondition",
            "message": "@ConditionalOnAvailableEndpoint no property management.endpoint.beans.enabled found so using endpoint default; @ConditionalOnAvailableEndpoint marked as exposed by a 'management.endpoints.jmx.exposure' property"
          }
        ],
        "BeansEndpointAutoConfiguration#beansEndpoint": [
          {
            "condition": "OnBeanCondition",
            "message": "@ConditionalOnMissingBean (types: org.springframework.boot.actuate.beans.BeansEndpoint; SearchStrategy: all) did not find any beans"
          }
        ],
 -----------------------------
在positiveMatches区域中,我们可以看到通过自动配置创建了一个MongoTemplate bean,这是因为目前上下文中没有这样的bean。导致这种配置结果的原因是这里包含了@ConditionalOnMissingBean注解,如果没有明确配置这个bean,就会自动配置它
在negativeMatches区域中,Spring Boot要尝试配置一个DispatcherServlet。但是,@ConditionalOnClass条件化注解失败了,这是因为没有找到DispatcherServlet类
最后,在 `unconditionalClasses`区域中是一个无条件配置的`ConfigurationPropertiesAutoConfiguration`。配置属性是Spring
Boot 操作的基础,所以任何与配置属性相关的配置都应该无条件自动装配。
探查环境和配置属性
"/env"获取spring应用中的所有属性元。包括: 环境变量、JVM系统属性、application.yml文件甚至来自Spring Cloud Config Server的属性
{
  "activeProfiles": [

  ],
  "propertySources": [
    {
      "name": "server.ports",
      "properties": {
        "local.server.port": {
          "value": 8888
        }
      }
    },
    {
      "name": "servletContextInitParams",
      "properties": {

      }
    },
    {
      "name": "systemProperties",
      "properties": {
        "java.runtime.name": {
          "value": "Java(TM) SE Runtime Environment"
        },
        "spring.output.ansi.enabled": {
          "value": "always"
        },
        "sun.boot.library.path": {
          "value": "D:\JavaEE\jdk-8\jre\bin"
        },
-----------------------------
- 还可以获取字段详情
$ curl localhost:8888/env/server.port
{
  "property": {
    "source": "applicationConfig: [classpath:/application.yml]",
    "value": 8888
  },
  "activeProfiles": [

  ],
  "propertySources": [
    {
      "name": "server.ports"
    },
    {
      "name": "servletConfigInitParams"
    },
    {
      "name": "servletContextInitParams"
    },
    {
      "name": "systemProperties"
    },
--------------------
也可以通过POST请求 对参数进行修改
curl localhost:8888/actuator/env
      -d '{"name":"tacocloud.discount.code","value":"taco1314"}'
      -H 'Content-type: application/json'

{"tacocloud.discount.code":"taco1314"}
修改后也可以进行删除 删除所有配置 这些数据都是临时的 重启后会消失
curl localhost:8081/actuator/env -X DELETE
{"tacocloud.discount.code":"taco1314"}
HTTP映射导览
Actuator的"/mappings"端点为应用中的所有HTTP请求处理器提供了一个一站式的视图,不管这些处理器来自Spring MVC控制器还是Actuator端点,我们都能一目了然的看清楚。要获取Spring Boot 应用中的所有端点的完整列表,我们只需要向"/mappings"发送get请求就可以了:
{
  "contexts": {
    "application-1": {
      "mappings": {
        "dispatcherServlets": {
          "dispatcherServlet": [
            {
              "handler": "Actuator web endpoint 'archaius'",
              "predicate": "{GET /actuator/archaius, produces [application/vnd.spring-boot.actuator.v3+json || application/vnd.spring-boot.actuator.v2+json || application/json]}",
              "details": {
                "handlerMethod": {
                  "className": "org.springframework.boot.actuate.endpoint.web.servlet.AbstractWebMvcEndpointHandlerMapping.OperationHandler",
                  "name": "handle",
                  "descriptor": "(Ljavax/servlet/http/HttpServletRequest;Ljava/util/Map;)Ljava/lang/Object;"
                },
                "requestMappingConditions": {
                  "consumes": [

                  ],
                  "headers": [

                  ],
                  "methods": [
                    "GET"
                  ],
                  "params": [

                  ],
                  "patterns": [
                    "/actuator/archaius"
                  ],
                  "produces": [
                    {
                      "mediaType": "application/vnd.spring-boot.actuator.v3+json",
                      "negated": false
                    },
                    {
                      "mediaType": "application/vnd.spring-boot.actuator.v2+json",
                      "negated": false
                    },
                    {
                      "mediaType": "application/json",
                      "negated": false
                    }
                  ]
                }
              }
            },
 --------------------------
管理日志级别
可以向"/loggers"路径发送get请求
{
  "levels": [
    "OFF",
    "ERROR",
    "WARN",
    "INFO",
    "DEBUG",
    "TRACE"
  ],
  "loggers": {
    "ROOT": {
      "configuredLevel": "INFO",
      "effectiveLevel": "INFO"
    },
    "com": {
      "configuredLevel": null,
      "effectiveLevel": "INFO"
    },
    "com.itheim": {
      "configuredLevel": null,
      "effectiveLevel": "INFO"
    },
    "com.itheim.SpringCloudClientApplication": {
      "configuredLevel": null,
      "effectiveLevel": "INFO"
    },
    "com.netflix": {
      "configuredLevel": null,
      "effectiveLevel": "INFO"
    },
    "com.netflix.appinfo": {
      "configuredLevel": null,
      "effectiveLevel": "INFO"
    },
    "com.netflix.appinfo.ApplicationInfoManager": {
      "configuredLevel": null,
      "effectiveLevel": "INFO"
    },
其中,configuredLevel属性展示了明确配置的日志级别(如果没有明确配置,则显示为null)。
effectiveLevel属性展示的是实际的日志级别,它可能是从父包或根logger继承下来的。
如果想获取特定的包的日志级别 可以通过"/loggers/{包名}"
例如,你只想知道taco.ingredients包的日志级别,那么可以发送请求到"/loggers/tacos/ingredients"
 "configuredLevel": null,
 "effectiveLevel": "INFO"
- 也可以通过发送POST请求对日志进行修改
curl localhost:8888/actuator/loggers/tacos/ingredients
       -d '{"configuredLevel":"DEBUG"}'
       -H "Content-type:application/json"
现在日志级别发生了改变
{
	"configuredLevel":"DEBUG",
	"effectiveLevel":"DEBUG"
}
查看应用的活动
如果我们能够时刻监视运行中应用的活动,Actuator提供了"/httptrace"、"/threaddump"、"/heapdump"端点。
跟踪HTTP活动
"/httptrace"端点能够报告应用所处理的最近100个请求的详情。
监控线程
”/threaddump“端点能够生成一个当前线程活动的快照。通过如下的"/threaddump"端点响应片段
{
  "threads": [
    {
      "threadName": "AsyncResolver-bootstrap-executor-0",
      "threadId": 95,
      "blockedTime": -1,
      "blockedCount": 0,
      "waitedTime": -1,
      "waitedCount": 56,
      "lockName": "java.util.concurrent.SynchronousQueue$TransferStack@7022e838",
      "lockOwnerId": -1,
      "lockOwnerName": null,
      "inNative": false,
      "suspended": false,
      "threadState": "WAITING",
      "stackTrace": [
        {
          "methodName": "park",
          "fileName": "Unsafe.java",
          "lineNumber": -2,
          "className": "sun.misc.Unsafe",
          "nativeMethod": true
        },
        {
          "methodName": "park",
          "fileName": "LockSupport.java",
          "lineNumber": 175,
          "className": "java.util.concurrent.locks.LockSupport",
          "nativeMethod": false
        },
        {
          "methodName": "awaitFulfill",
          "fileName": "SynchronousQueue.java",
          "lineNumber": 458,
          "className": "java.util.concurrent.SynchronousQueue$TransferStack",
          "nativeMethod": false
        },
        {
          "methodName": "transfer",
          "fileName": "SynchronousQueue.java",
          "lineNumber": 362,
          "className": "java.util.concurrent.SynchronousQueue$TransferStack",
          "nativeMethod": false
        },
这里包含了线程阻塞和锁定状态,以及其他线程的细节
获取应用的指标
"/metrics"端点可以获取应用运行过程中的各项指标,包括 内存、处理器、垃圾收集
{
  "names": [
    "http.server.requests",
    "jvm.buffer.count",
    "jvm.buffer.memory.used",
    "jvm.buffer.total.capacity",
    "jvm.classes.loaded",
    "jvm.classes.unloaded",
    "jvm.gc.live.data.size",
    "jvm.gc.max.data.size",
    "jvm.gc.memory.allocated",
    "jvm.gc.memory.promoted",
    "jvm.gc.pause",
    "jvm.memory.committed",
    "jvm.memory.max",
    "jvm.memory.used",
    "jvm.threads.daemon",
    "jvm.threads.live",
    "jvm.threads.peak",
    "jvm.threads.states",
    "logback.events",
    "process.cpu.usage",
    "process.start.time",
    "process.uptime",
    "system.cpu.count",
    "system.cpu.usage",
    "tomcat.sessions.active.current",
    "tomcat.sessions.active.max",
    "tomcat.sessions.alive.max",
    "tomcat.sessions.created",
    "tomcat.sessions.expired",
    "tomcat.sessions.rejected"
  ]
}
我们可以只针对一个指标 获取"http.server.requests"信息
{
  "name": "http.server.requests",
  "description": null,
  "baseUnit": "seconds",
  "measurements": [
    {
      "statistic": "COUNT",
      "value": 20.0
    },
    {
      "statistic": "TOTAL_TIME",
      "value": 0.883478498
    },
    {
      "statistic": "MAX",
      "value": 0.0
    }
  ],
  "availableTags": [
    {
      "tag": "exception",
      "values": [
        "None",
        "HttpRequestMethodNotSupportedException"
      ]
    },
    {
      "tag": "method",
      "values": [
        "post",
        "POST",
        "GET"
      ]
    },
    {
      "tag": "uri",
      "values": [
        "/actuator/metrics/{requiredMetricName}",
        "/actuator/beans",
        "/actuator/threaddump",
        "root",
        "/actuator/health",
        "/actuator/env/{toMatch}",
        "/actuator/loggers",
        "/actuator/mappings",
        "/actuator/metrics",
        "/actuator/conditions",
        "/**",
        "/actuator/env"
      ]
    },
    {
      "tag": "outcome",
      "values": [
        "CLIENT_ERROR",
        "SUCCESS"
      ]
    },
    {
      "tag": "status",
      "values": [
        "404",
        "405",
        "200"
      ]
    }
  ]
}
最重要的组成为measurements区域,它包含了所请求分类的所有指标数据。在本例中,它表示一共有200个体Http请求,处理这些请求的总耗时为0.883478498秒,处理单个请求为0.0秒
如果我们向具体到请求状态为多少的请求 可以使用status:404获取请求状态为404的请求
$ curl localhost:8888/actuator/metrics/http.server.requests?tag=status:404
{
  "name": "http.server.requests",
  "description": null,
  "baseUnit": "seconds",
  "measurements": [
    {
      "statistic": "COUNT",
      "value": 3.0
    },
    {
      "statistic": "TOTAL_TIME",
      "value": 0.09725639999999999
    },
    {
      "statistic": "MAX",
      "value": 0.0
    }
  ],
  "availableTags": [
    {
      "tag": "exception",
      "values": [
        "None"
      ]
    },
    {
      "tag": "method",
      "values": [
        "GET"
      ]
    },
    {
      "tag": "uri",
      "values": [
        "/actuator/env/{toMatch}",
        "/**"
      ]
    },
    {
      "tag": "outcome",
      "values": [
        "CLIENT_ERROR"
      ]
    }
  ]
}
我们可以看到一些失败请求的路径为"/actuator/env/{toMatch}", "/**",有些是发送到其他路径是通过"/"获取的**
// $ curl localhost:8888/actuator/metrics/http.server.requests?tag=status:404&tag=uri:/**
{
  "name": "http.server.requests",
  "description": null,
  "baseUnit": "seconds",
  "measurements": [
    {
      "statistic": "COUNT",
      "value": 2.0
    },
    {
      "statistic": "TOTAL_TIME",
      "value": 0.0932196
    },
    {
      "statistic": "MAX",
      "value": 0.0
    }
  ],
  "availableTags": [
    {
      "tag": "exception",
      "values": [
        "None"
      ]
    },
    {
      "tag": "method",
      "values": [
        "GET"
      ]
    },
    {
      "tag": "outcome",
      "values": [
        "CLIENT_ERROR"
      ]
    }
  ]
}
自定义Actuator
创建自定义的Info贡献者
我们为"/info"端点添加关于taco的信息,为了实现这一点我们需要编写并实现InfoContributor端口的类,并将信息提供到"/info"端点。
@Component
public class TacoInfoContributor implements org.springframework.boot.actuate.info.InfoContributor {


    @Override
    public void contribute(Info.Builder builder) {
        int i=10;
        HashMap<String, Object> map = new HashMap<>();
        //设置数量
        map.put("count",i);
        //添加详情信息
        builder.withDetail("taco-stats",map);
    }
}
{
  "taco-stats": {
    "count": 10
  }
}
注入构建信息到"/info"端点中
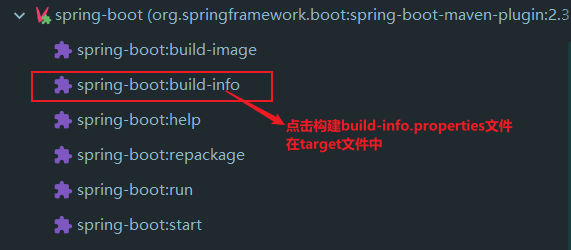
·Spring Boot提供了一些内置的InfoContributor实现,他们能够自动添加信息到"/info"端点的结果中。其中有一个实现是BuildInfoContributor,它能够将项目构建文件中的信息添加到"/info"端点的结果中。这包括了一些基本信息,比如项目版本、构建的时间戳以及执行构建的主机和用户。
添加插件 build-info goal到Spring Boot maven中
           <plugin>
                <groupId>org.springframework.boot</groupId>
                <artifactId>spring-boot-maven-plugin</artifactId>
                <executions>
                    <execution>
                        <goals>
                            <goal>build-info</goal>
                        </goals>
                    </execution>
                </executions>
            </plugin>
先通过插件构建
- 然后访问info端点 得到下面的结果
{
  "build": {
    "version": "1.0-SNAPSHOT",
    "artifact": "spring-cloud-client",
    "name": "spring-cloud-client",
    "group": "org.example",
    "time": "2021-02-01T04:46:43.664Z"
  },
  "taco-stats": {
    "count": 10
  }
}
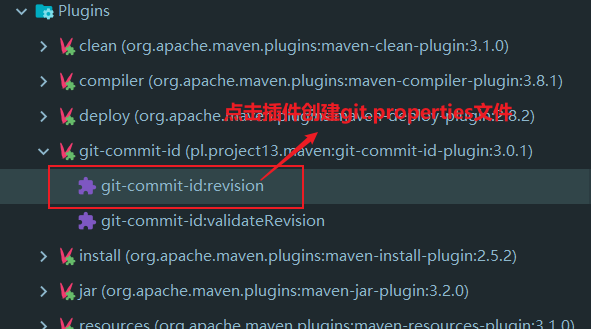
暴露Git提交信息
假设我们的项目使用git进行源码控制,那么我们可以在"/info"端点中包含Git提交信息
           <plugin>
                <groupId>pl.project13.maven</groupId>
                <artifactId>git-commit-id-plugin</artifactId>
            </plugin>
然后创建git版本库
git init
git add .
git commit -m "首次提交"
- 访问端点得到信息
 "git": {
    "commit": {
      "time": "2021-02-01T04:58:19Z",
      "id": "c9ce0d2"
    },
    "branch": "master"
  },
- 如果想获取详细的git信息可以 设置
yml属性
 info:
    git:
      mode: full
{
  "git": {
    "build": {
      "host": "DESKTOP-TP0O298",
      "version": "1.0-SNAPSHOT",
      "time": "2021-02-01T05:01:41Z",
      "user": {
        "name": "ZGrey",
        "email": "1589391440@qq.com"
      }
    },
    "branch": "master",
    "commit": {
      "message": {
        "short": "11",
        "full": "11"
      },
      "id": {
        "describe": "c9ce0d2",
        "abbrev": "c9ce0d2",
        "describe-short": "c9ce0d2",
        "full": "c9ce0d20ab5f503631f8055df6e115817a6cd487"
      },
      "time": "2021-02-01T04:58:19Z",
      "user": {
        "email": "1589391440@qq.com",
        "name": "ZGrey"
      }
    },
    "closest": {
      "tag": {
        "name": "",
        "commit": {
          "count": ""
        }
      }
    },
    "local": {
      "branch": {
        "ahead": "NO_REMOTE",
        "behind": "NO_REMOTE"
      }
    },
    "dirty": "false",
    "remote": {
      "origin": {
        "url": "Unknown"
      }
    },
    "tags": "",
    "total": {
      "commit": {
        "count": "2"
      }
    }
  },
创建自定义的指标
"/metrics"是由Micrometer实现的。这是一个供应商中立的指标门面,借助它,我们能够发送任意想要的指标,并在所选的第三方监控系统中对其进行展现。他提供了对Prometheus、Datadog和New Relic等系统的支持。
创建自定义的端点
Actuator的定义与控制器有很大的差异。Actuator端点并不是使用@Controller或@RestController注解来标注类,而是通过为类添加@Endpoint注解来实现的。
另外,他们不是使用Http方法命名的注解,如@GetMapping、@PostMapping、@DeleteMapping,Actuator端点的操作是通过添加
@ReadOperation、@WriteOperation、@DeleteOperation注解实现的。这些注解并没有指明任何的通信机制,实际上,这允许Actuator与各种各样的通信机制协作,内置了对HTTP和JMX的支持
package com.itheim.endpoint;

import org.springframework.boot.actuate.endpoint.annotation.DeleteOperation;
import org.springframework.boot.actuate.endpoint.annotation.Endpoint;
import org.springframework.boot.actuate.endpoint.annotation.ReadOperation;
import org.springframework.boot.actuate.endpoint.annotation.WriteOperation;
import org.springframework.stereotype.Component;

import java.util.ArrayList;
import java.util.List;

/**
 * @program: spring-cloud
 * @description:
 * @author: Mr.ZGrey
 * @create: 2021-02-01 19:32
 **/
@Component
@Endpoint(id = "notes",enableByDefault = true)
public class NotesEndpoint   {
    private List<Note> notes=new ArrayList<>();
    @ReadOperation
    public List<Note> notes(){
        return notes;
    }

    @WriteOperation
    public List<Note> addNote(String text){
        notes.add(new Note(text));
        return notes;
    }

    @DeleteOperation
    public List<Note> deleteNote(int index){
        if (index<notes.size()){
            notes.remove(index);
        }
        return notes;
    }

}
- Node类需要编写
我们可以通过POST请求对端点notes进行测试
curl localhost:8888/actuator/notes  -d'{"text":"hello"}' -H"Content-type:application/json"
[{"text":"hello"}]
当新增时端点数量会增加
$ curl localhost:8888/actuator/notes
[{"text":"hello"}]
- 删除笔记 Delete请求
localhost:8888/actuator/notes?index=1  -X DELETE
[{"text":"hello"}]
- 如果只想暴露HTTP端点,那么可以使用
@WebEndpoint注解而不是@Endpoint来标注端点类:
@Component
//@Endpoint(id = "notes",enableByDefault = true)
@WebEndpoint(id="notes",enableByDefault = true)
public class NotesEndpoint   {
       ----------------------
}
类似的如果只想暴露MBean端点,可以使用@JmxEndpoint注解进行标注
保护Actuator
我们可以通过使用Spring security对Actuator进行访问保护
public class ActuatorSecurity extends WebSecurityConfigurerAdapter {
    @Override
    protected void configure(HttpSecurity http) throws Exception {
        http.authorizeRequests()
                .antMatchers("/actuator/**")
                .hasRole("ADMIN")
                .and()
                .httpBasic();
    }

}
- 为了解除硬编码的"/actuator/**"设置 spring Boot 提供了EndpointRequest(一个请求匹配类,更简单,而且不依赖于给定的String路径) 我们可以通过以下方式获取
   @Override
    protected void configure(HttpSecurity http) throws Exception {
        http.authorizeRequests()
                .requestMatchers(EndpointRequest.toAnyEndpoint())
                .hasRole("ADMIN")
                .and()
                .httpBasic();
    }
EndpointRequest.toAnyEndpoint()方法会返回一个请求匹配器,它会匹配所有的Actuator端点。如果你想要将某些端点从请求匹配器中移除,那么可以电泳excluding()方法
 @Override
    protected void configure(HttpSecurity http) throws Exception {
        http.authorizeRequests()
                .requestMatchers(EndpointRequest.toAnyEndpoint().excluding("health","env"))
                .hasRole("ADMIN")
                .and()
                .httpBasic();
    }
- 另外我们只想用到一部分,可以使用以下方式获取
  @Override
    protected void configure(HttpSecurity http) throws Exception {
        http.authorizeRequests()
                .requestMatchers(EndpointRequest.to("env","health"))
                .hasRole("ADMIN")
                .and()
                .httpBasic();
    }
这样的话只会保护"env"和"health"端点,其他的端点会全部对外开放
- 小结
Spring Boot Actuator 以Http和JMX MBean的形式提供了多个断点。