1、echart 指标为0的时候,让标签不显示
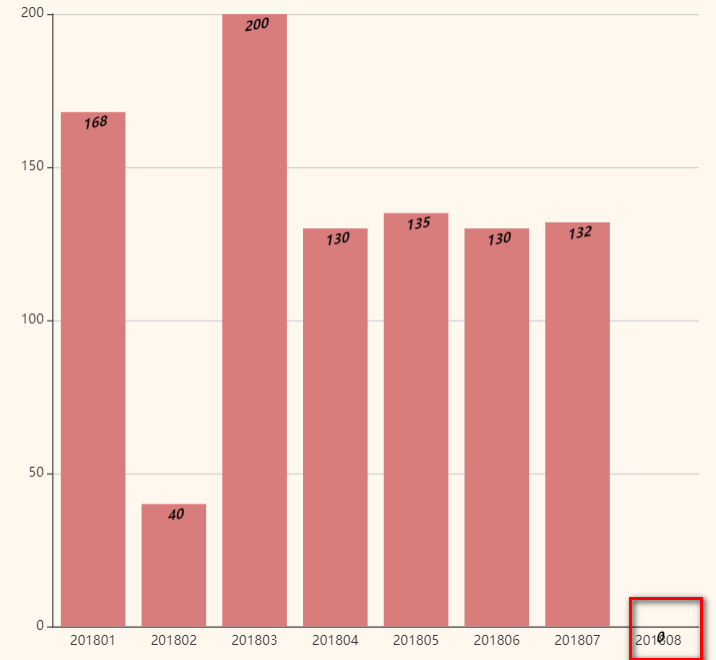
在label的formatter里面编写回调函数:见下
series: [
{
type: 'bar',
name:'INV',
stack: '整体机型',
encode: {x: '月份', y: 'INV'}, //选择数据源中数据作为x-y列
label: {
show: true,
position:'insideTop',
color:'black',
fontWeight:'bold',
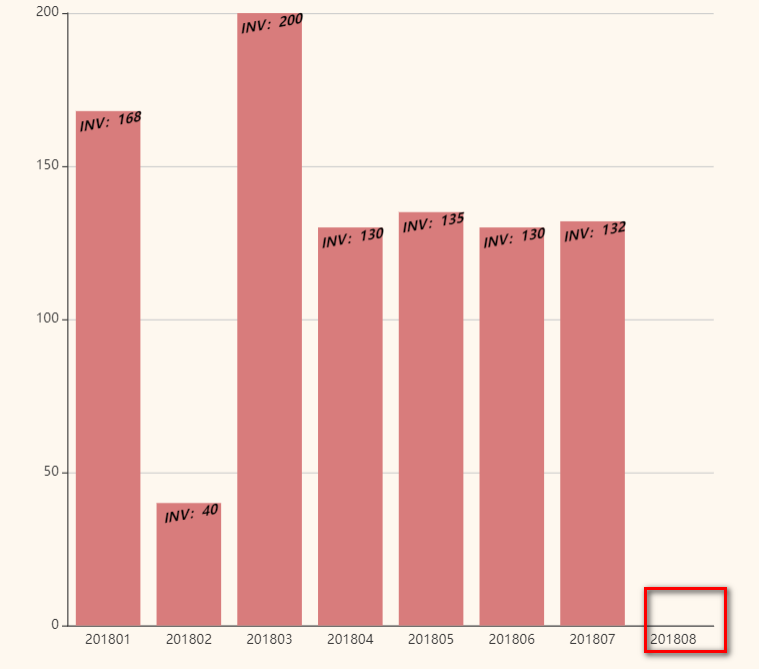
formatter: function (params) {
console.log('{a}');
//1字符串转json,然后通过json的值去取 TODO
var jsonObj = params.value;
//2、遍历Json串获取其属性
for(var item in jsonObj){
if(item=='INV'){ //item 表示Json串中的属性,如'name'
var jValue=jsonObj[item];//key所对应的value
if(jValue== 0 ){
return '';
}
return (item+':'+jValue);
}
}
},
rotate:10,
fontStyle:'oblique',
},
}
]
效果:
2、更改series里面内容,删除series
要求,点击一个item之后,会跳进该数据集中:
上代码:
myChart.on('click', function(params) {
                    //点击的item的seriesname
                    var seriesName = params.seriesName
                    var seriesValue =params.data[params.seriesName];
                    var colName = '时间轴';
                    var colValue = params.name;
                    var jsonArr;
                    //自定义json数组 ,因为传了变量,所以得使用eval
                    eval("var jsonArr = [{"+colName+":'"+ colValue +"','"+seriesName+"':"+seriesValue+"}]");
                    //dataSource赋值
                    option.dataset.source = jsonArr;
                    //遍历series
                    for(var i in option.series){
                        for(var item in option.series[i]){
                            var sername =  option.series[i].name;
                            //判断点击的item的seriesname和当前的遍历的series不同时,删除该series
                            if(sername != seriesName){
                                option.series.splice(i,1)
                                break;
                            }
                        }
                    }
                    //清除实例
                    myChart.clear;
                    //增加 chart.setOption(option, notMerge, lazyUpdate);
                    //notMerge 可选,是否不跟之前设置的 option 进行合并,默认为 false,即合并。
                    myChart.setOption(option,true);

                });
效果:
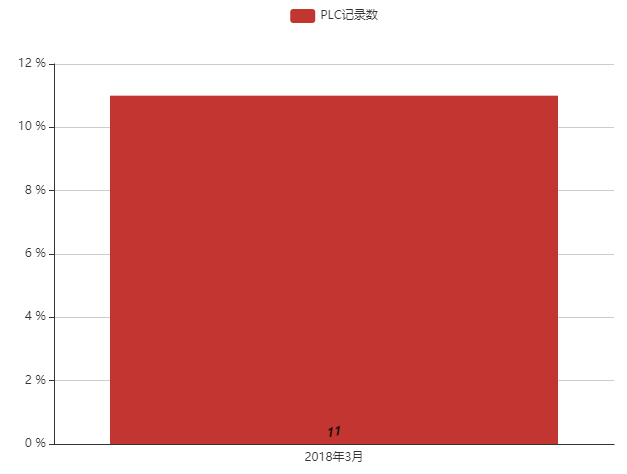
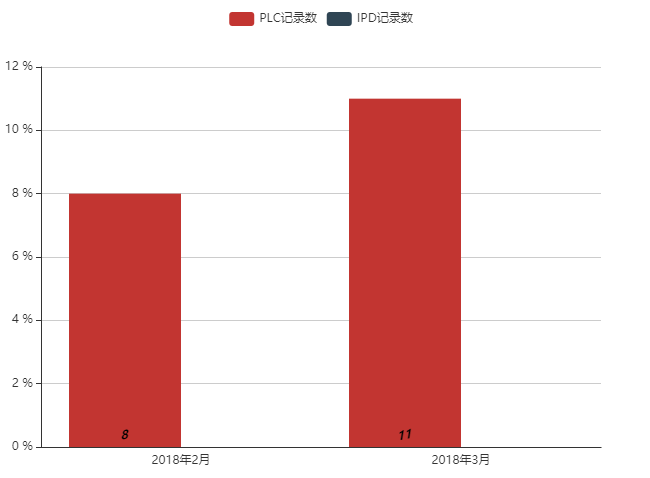
3.定义series时候,明明没有数据却会有数据展示,怪现象(这个例子不对,错了!!)
datasetIndex 只是针对多个dataset的时候,指定第几个dataset而已,当然不想展示数据的时候,也可以指定一个不存在的dataset
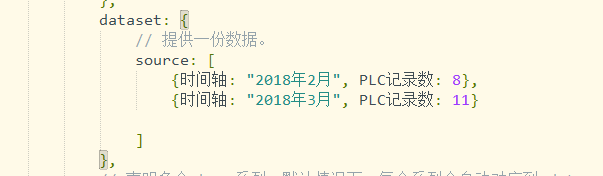
下面声明series中,第一个series是有数据的,第二个理论上没有数据,图却展示了数据


                series: [{
                        type: 'bar',
                        name: 'PLC记录数',
                        //设置柱子的间距
                        barGap: 0,
                        stack: '整体机型',
                        //选择数据源中数据作为x-y列
                        encode: {
                            x: '时间轴',
                            y: 'PLC记录数'
                        },
                        //设置dataset的选择指标,注意如果这里没有且y轴设置的名称没有的话,会默认选择第一个
                        // datasetIndex:0,
                        emphasis:{
                            itemStyle:{
                                color: 'pink'
                            }
                        },
                        label: {
                            show: true,
                            position: 'insideBottom',
                            color: 'black',
                            fontWeight: 'bold',
                            rotate: 10,
                            fontStyle: 'oblique',
                        },
                    },
                    {
                        type: 'bar',
                        name: 'IPD记录数',
                        //设置柱子的间距
                        barGap: 0,
                        //选择数据源中数据作为x-y列
                        encode: {
                            x: '时间轴',
                            y: 'IPD记录数'
                        },
                        //设置dataset的选择指标,注意如果这里没有且y轴设置的名称没有的话,会默认选择第一个
                        // datasetIndex:1,
                        tooltip:{
                            backgroundColor:'blue'
                        },
                        label: {
                            show: true,
                            position: 'insideBottom',
                            color: 'black',
                            fontWeight: 'bold',
                            rotate: 10,
                            fontStyle: 'oblique',
                        },
                    }
                ]
            }
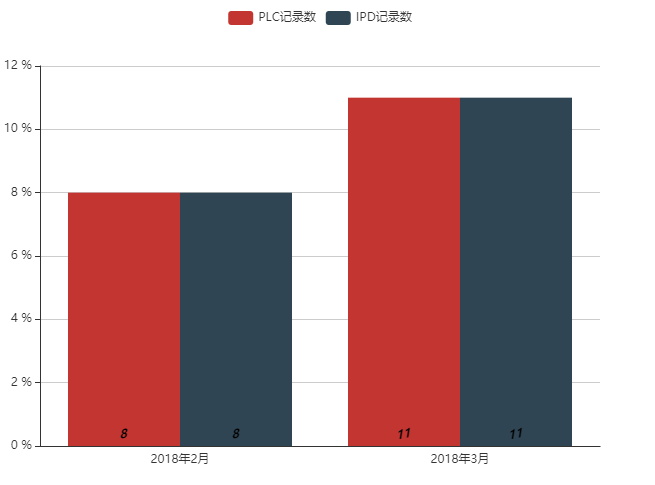
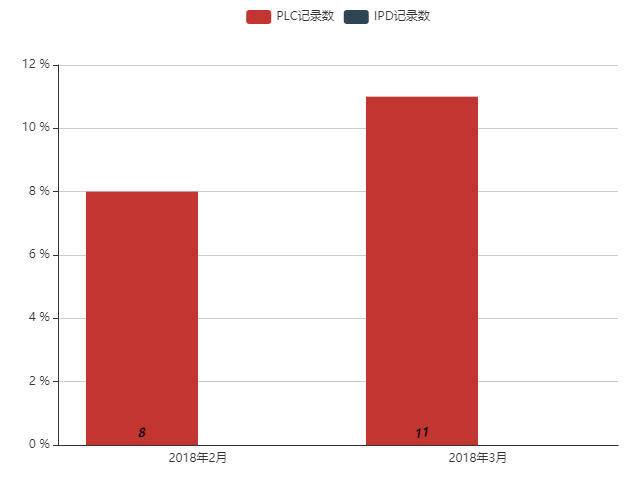
正确写法:
series: [{
                        type: 'bar',
                        name: 'PLC记录数',
                        //设置柱子的间距
                        barGap: 0,
                        stack: '整体机型',
                        //选择数据源中数据作为x-y列
                        encode: {
                            x: '时间轴',
                            y: 'PLC记录数'
                        },
                        //设置dataset的选择指标,注意如果这里没有且y轴设置的名称没有的话,会默认选择第一个dataset
                        datasetIndex:0,
                        emphasis:{
                            itemStyle:{
                                color: 'pink'
                            }
                        },
                        label: {
                            show: true,
                            position: 'insideBottom',
                            color: 'black',
                            fontWeight: 'bold',
                            rotate: 10,
                            fontStyle: 'oblique',
                        },
                    },
                    {
                        type: 'bar',
                        name: 'IPD记录数',
                        //设置柱子的间距
                        barGap: 0,
                        //选择数据源中数据作为x-y列
                        encode: {
                            x: '时间轴',
                            y: 'IPD记录数'
                        },
                        //设置dataset的选择指标,注意如果这里没有且y轴设置的名称没有的话,会默认选择第一个
                        datasetIndex:1,
                        tooltip:{
                            backgroundColor:'blue'
                        },
                        label: {
                            show: true,
                            position: 'insideBottom',
                            color: 'black',
                            fontWeight: 'bold',
                            rotate: 10,
                            fontStyle: 'oblique',
                        },
                    }
                ]
结果: