在postgresql的高可用架构中,通常会采用流复制机制实现主备,edb提供了一个性能影响的参考:
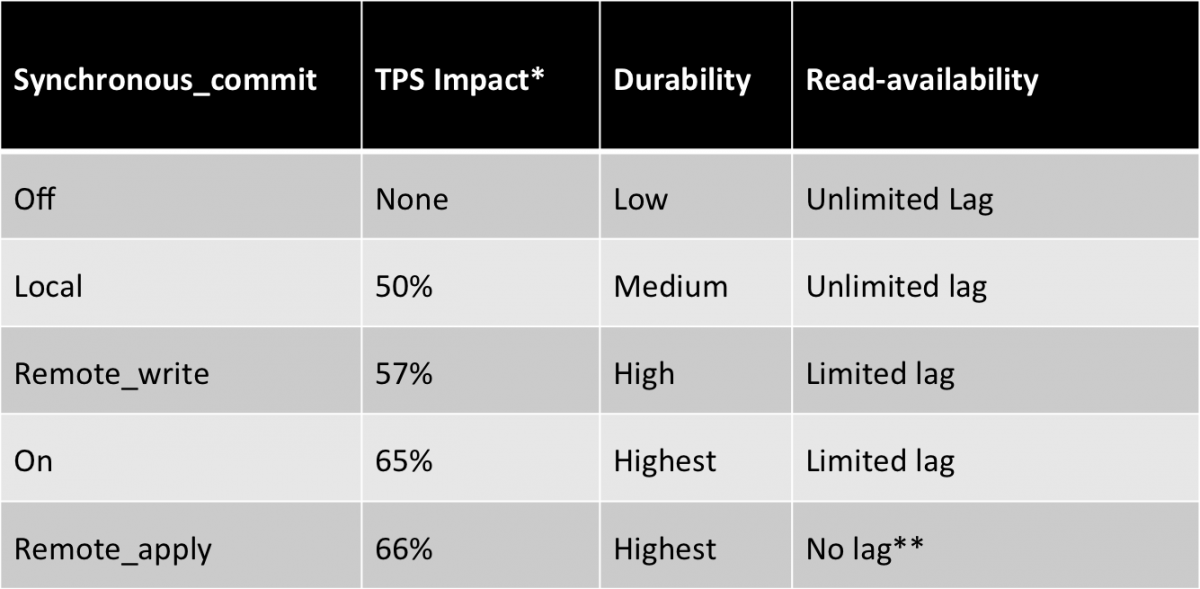
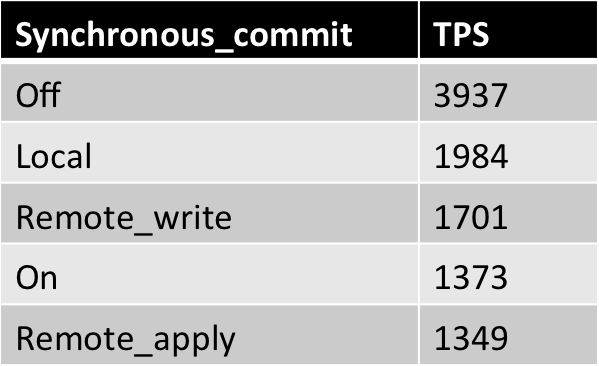
从上可知,HA模式大约会下降10%-30%左右的性能,remote_write因为仅仅写入了standby的内存,所以性能影响很小。on完全取决于对端磁盘的性能,本质上就是WAL串行写两次+一次网络。当前如果主节点没有跑到瓶颈例如cpu没跑满、IO满了,网络没有到瓶颈,那么很可能HA的TPS和单实例的TPS是一样的,只有网络成为瓶颈时,HA才会是问题,例如跑批需要同步时。
笔者环境使用lightdb for pg版本时,ltbench可以非常稳定的跑到70000 tps,响应时间在1.5毫秒,采用PMEM存储,在迈络思roce下,local、remote_apply、on相差在10%以内,主节点cpu利用率在80%左右。
而为了实现自动故障转移,一般会选择采用repmgr(当然也有Patroni(用python写的)和pg_auto_failover),我们推荐repmgr做failover管理,keepalived作为客户端透明故障转移。lightdb for pg使用类似机制,但做了稳定性和可靠性加强。
repmgr配置项
在repmgr中除了基本配置外,还有几个非常重要但是经常会被忽略的配置项目,主要和事件通知相关。
https://repmgr.org/docs/repmgr.html#EVENT-NOTIFICATIONS
repmgr命令主要如下:
repmgr primary register — initialise a repmgr installation and register the primary node
repmgr primary unregister — unregister an inactive primary node
repmgr standby clone — clone a PostgreSQL standby node from another PostgreSQL node
repmgr standby register — add a standby's information to the repmgr metadata
repmgr standby unregister — remove a standby's information from the repmgr metadata
repmgr standby promote — promote a standby to a primary
repmgr standby follow — attach a running standby to a new upstream node
repmgr standby switchover — promote a standby to primary and demote the existing primary to a standby
repmgr witness register — add a witness node's information to the repmgr metadata
repmgr witness unregister — remove a witness node's information to the repmgr metadata
===========日常管理主要使用node,cluster以及service三类为主。上面三类主要用于初始安装和维护。
repmgr node status — show overview of a node's basic information and replication status
repmgr node check — performs some health checks on a node from a replication perspective
repmgr node rejoin — rejoin a dormant (stopped) node to the replication cluster
repmgr node service — show or execute the system service command to stop/start/restart/reload/promote a node
repmgr cluster show — display information about each registered node in the replication cluster
repmgr cluster matrix — runs repmgr cluster show on each node and summarizes output
repmgr cluster crosscheck — cross-checks connections between each combination of nodes
repmgr cluster event — output a formatted list of cluster events
repmgr cluster cleanup — purge monitoring history
repmgr service status — display information about the status of repmgrd on each node in the cluster
repmgr service pause — Instruct all repmgrd instances in the replication cluster to pause failover operations
repmgr service unpause — Instruct all repmgrd instances in the replication cluster to resume failover operations
repmgr daemon start — Start the repmgrd daemon on the local node
repmgr daemon stop — Stop the repmgrd daemon on the local node
比较重要的是:
- 查看集群节点角色和状态。(任意节点执行,包含所有节点的信息)
repmgr cluster show -f /home/lightdb/lightdb-x/13.3-21.2/etc/repmgr/repmgr.conf
 ID | Name                       | Role    | Status    | Upstream                  | Location | Priority | Timeline | Connection string
----+----------------------------+---------+-----------+---------------------------+----------+----------+----------+------------------------------------------------------------------------
 1  | 10.19.36.10-defaultcluster | standby |   running | 10.19.36.9-defaultcluster | default  | 100      | 5        | host=10.19.36.10 port=5432 user=repmgr dbname=repmgr connect_timeout=2
 2  | 10.19.36.9-defaultcluster  | primary | * running |                           | default  | 100      | 5        | host=10.19.36.9 port=5432 user=repmgr dbname=repmgr connect_timeout=2
- 查看repmgrd守护进程状态。(任意节点执行,包含所有节点的信息)
[lightdb@localhost ~]$ repmgr service status -f /home/lightdb/lightdb-x/13.3-21.2/etc/repmgr/repmgr.conf
 ID | Name                       | Role    | Status    | Upstream                  | repmgrd | PID     | Paused? | Upstream last seen
----+----------------------------+---------+-----------+---------------------------+---------+---------+---------+--------------------
 1  | 10.19.36.10-defaultcluster | standby |   running | 10.19.36.9-defaultcluster | running | 3324044 | no      | 0 second(s) ago
 2  | 10.19.36.9-defaultcluster  | primary | * running |                           | running | 4170296 | no      | n/a
- -- csv可以生成csv格式,便于自动化分析,如下:
[lightdb@localhost ~]$ repmgr service status -f /home/lightdb/lightdb-x/13.3-21.2/etc/repmgr/repmgr.conf --csv
1,10.19.36.10-defaultcluster,standby,1,1,3324044,0,100,1,default
2,10.19.36.9-defaultcluster,primary,1,1,4170296,0,100,-1,default
- 查看本节点角色以及状态、复制延时(基本上status就足够)(仅包含本节点的信息)
[lightdb@localhost ~]$ repmgr node status -f /home/lightdb/lightdb-x/13.3-21.2/etc/repmgr/repmgr.conf
Node "10.19.36.10-defaultcluster":
    LightDB version: 13.3
    Total data size: 9086 MB
    Conninfo: host=10.19.36.10 port=5432 user=repmgr dbname=repmgr connect_timeout=2
    Role: standby
    WAL archiving: disabled (on standbys "archive_mode" must be set to "always" to be effective)   # 除非设置为always,否则在WAL replay时总是仅用。
    Archive command: test ! -f /home/lightdb/lightdb-x/13.3-21.2/archive/%f && cp %p /home/lightdb/lightdb-x/13.3-21.2/archive/%f && find /home/lightdb/lightdb-x/13.3-21.2/archive -type f -mmin +10080 | xargs -i rm {}
    WALs pending archiving: 2 pending files
    Replication connections: 0 (of maximal 10)
    Replication slots: 0 physical (of maximal 10; 0 missing)
    Upstream node: 10.19.36.9-defaultcluster (ID: 2)
    Replication lag: 55 seconds     # 第一次不太准,可能会比较高
    Last received LSN: 6/F641CCE8
    Last replayed LSN: 6/F64159D0
如果不放心可以查下check,check做了实时检查。就监控而言,保守起见,两个都执行(仅包含本节点的信息)。
[lightdb@localhost ~]$ repmgr node check -f /home/lightdb/lightdb-x/13.3-21.2/etc/repmgr/repmgr.conf
Node "10.19.36.10-defaultcluster":
    Server role: OK (node is standby)
    Replication lag: OK (0 seconds)
    WAL archiving: OK (2 pending archive ready files)
    Upstream connection: OK (node "10.19.36.10-defaultcluster" (ID: 1) is attached to expected upstream node "10.19.36.9-defaultcluster" (ID: 2))
    Downstream servers: OK (this node has no downstream nodes)
    Replication slots: OK (node has no physical replication slots)
    Missing physical replication slots: OK (node has no missing physical replication slots)
    Configured data directory: OK (configured "data_directory" is "/home/lightdb/data/defaultCluster")
查看集群节点间连通性(任意节点执行,包含所有节点的信息)。
[lightdb@localhost ~]$ repmgr cluster crosscheck -f /home/lightdb/lightdb-x/13.3-21.2/etc/repmgr/repmgr.conf
INFO: connecting to database
 Name                       | ID | 1 | 2
----------------------------+----+---+---
 10.19.36.10-defaultcluster | 1  | * | *
 10.19.36.9-defaultcluster  | 2  | * | *
- 监控从节点异常(除非主节点选择的同步模式是local,如果为on、remote_apply或remote_write,就必须监控从节点,以避免从节点发生异常时,主节点停止工作,从而影响生产)。
============================上述主要是监控,下面来看一下日常管理类。
- 节点维护重启。
[lightdb@lightdb1 ~]$ repmgr service pause -f /mnt/pmem1/lightdb/lightdb-x/13.3-21.2/etc/repmgr/repmgr.conf
NOTICE: node 1 (10.20.137.41-defaultcluster) paused
NOTICE: node 2 (10.20.137.42-defaultcluster) paused
[lightdb@lightdb1 ~]$ repmgr service status -f /mnt/pmem1/lightdb/lightdb-x/13.3-21.2/etc/repmgr/repmgr.conf
 ID | Name                        | Role    | Status    | Upstream                    | repmgrd | PID    | Paused? | Upstream last seen
----+-----------------------------+---------+-----------+-----------------------------+---------+--------+---------+--------------------
 1  | 10.20.137.41-defaultcluster | primary | * running |                             | running | 38834  | yes     | n/a
 2  | 10.20.137.42-defaultcluster | standby |   running | 10.20.137.41-defaultcluster | running | 185064 | yes     | 1 second(s) ago

。。。。修改参数,重启实例。。。。
期间,standby的repmgr日志会一直尝试重试,如下:
[2021-10-30 18:22:14] [INFO] node "10.20.137.42-defaultcluster" (ID: 2) monitoring upstream node "10.20.137.41-defaultcluster" (ID: 1) in normal state
[2021-10-30 18:22:14] [DETAIL] last monitoring statistics update was 2 seconds ago
[2021-10-30 18:23:12] [WARNING] unable to ping "host=10.20.137.41 port=5432 user=repmgr dbname=repmgr connect_timeout=2"
[2021-10-30 18:23:12] [DETAIL] PQping() returned "PQPING_REJECT"
[2021-10-30 18:23:12] [WARNING] unable to connect to upstream node "10.20.137.41-defaultcluster" (ID: 1)
[2021-10-30 18:23:12] [INFO] checking state of node "10.20.137.41-defaultcluster" (ID: 1), 1 of 3 attempts
[2021-10-30 18:23:12] [WARNING] unable to ping "user=repmgr connect_timeout=2 dbname=repmgr host=10.20.137.41 port=5432 fallback_application_name=repmgr"
[2021-10-30 18:23:12] [DETAIL] PQping() returned "PQPING_REJECT"
[2021-10-30 18:23:12] [INFO] sleeping up to 5 seconds until next reconnection attempt
[2021-10-30 18:23:17] [INFO] checking state of node "10.20.137.41-defaultcluster" (ID: 1), 2 of 3 attempts
[2021-10-30 18:23:17] [WARNING] unable to ping "user=repmgr connect_timeout=2 dbname=repmgr host=10.20.137.41 port=5432 fallback_application_name=repmgr"
[2021-10-30 18:23:17] [DETAIL] PQping() returned "PQPING_REJECT"
[2021-10-30 18:23:17] [INFO] sleeping up to 5 seconds until next reconnection attempt
[2021-10-30 18:23:22] [INFO] checking state of node "10.20.137.41-defaultcluster" (ID: 1), 3 of 3 attempts
[2021-10-30 18:23:22] [WARNING] unable to ping "user=repmgr connect_timeout=2 dbname=repmgr host=10.20.137.41 port=5432 fallback_application_name=repmgr"
[2021-10-30 18:23:22] [DETAIL] PQping() returned "PQPING_REJECT"
[2021-10-30 18:23:22] [WARNING] unable to reconnect to node "10.20.137.41-defaultcluster" (ID: 1) after 3 attempts
[2021-10-30 18:23:22] [NOTICE] repmgrd on this node is paused
[2021-10-30 18:23:22] [DETAIL] no failover will be carried out
[2021-10-30 18:23:22] [HINT] execute "repmgr service unpause" to resume normal failover mode
[2021-10-30 18:23:22] [WARNING] unable to ping "host=10.20.137.41 port=5432 user=repmgr dbname=repmgr connect_timeout=2"
[2021-10-30 18:23:22] [DETAIL] PQping() returned "PQPING_REJECT"
[2021-10-30 18:23:22] [ERROR] unable to execute get_primary_current_lsn()
[2021-10-30 18:23:22] [DETAIL]
FATAL:  terminating connection due to administrator command
server closed the connection unexpectedly
    This probably means the server terminated abnormally
    before or while processing the request.

[2021-10-30 18:23:22] [WARNING] unable to retrieve primary's current LSN
[2021-10-30 18:23:24] [WARNING] unable to ping "host=10.20.137.41 port=5432 user=repmgr dbname=repmgr connect_timeout=2"
[2021-10-30 18:23:24] [DETAIL] PQping() returned "PQPING_REJECT"
[2021-10-30 18:23:24] [WARNING] unable to ping "host=10.20.137.41 port=5432 user=repmgr dbname=repmgr connect_timeout=2"
[2021-10-30 18:23:24] [DETAIL] PQping() returned "PQPING_REJECT"
[2021-10-30 18:23:26] [WARNING] unable to ping "host=10.20.137.41 port=5432 user=repmgr dbname=repmgr connect_timeout=2"
[2021-10-30 18:23:26] [DETAIL] PQping() returned "PQPING_NO_RESPONSE"
[2021-10-30 18:23:26] [WARNING] unable to ping "host=10.20.137.41 port=5432 user=repmgr dbname=repmgr connect_timeout=2"
[2021-10-30 18:23:26] [DETAIL] PQping() returned "PQPING_NO_RESPONSE"
[2021-10-30 18:23:28] [NOTICE] upstream is available but upstream connection has gone away, resetting
[2021-10-30 18:23:28] [NOTICE] reconnected to upstream node "10.20.137.41-defaultcluster" (ID: 1) after 6 seconds, resuming monitoring
[2021-10-30 18:27:16] [INFO] node "10.20.137.42-defaultcluster" (ID: 2) monitoring upstream node "10.20.137.41-defaultcluster" (ID: 1) in normal state
[2021-10-30 18:27:16] [DETAIL] last monitoring statistics update was 2 seconds ago
pg日志如下:
2021-10-30 18:12:30.114559T  @  checkpointer  00000[2021-10-29 20:45:28 CST] 0 [115395] DETAIL:  Last completed transaction was at log time 2021-10-30 18:12:30.084333+08.
2021-10-30 18:14:41.898079T  @  walreceiver  00000[2021-10-30 17:58:15 CST] 0 [144662] LOG:  replication terminated by primary server
2021-10-30 18:14:41.898079T  @  walreceiver  00000[2021-10-30 17:58:15 CST] 0 [144662] DETAIL:  End of WAL reached on timeline 3 at 10/800000A0.
2021-10-30 18:14:41.898109T  @  walreceiver  XX000[2021-10-30 17:58:15 CST] 0 [144662] FATAL:  could not send end-of-streaming message to primary: no COPY in progress
2021-10-30 18:14:41.898250T  @  startup  00000[2021-10-29 20:45:28 CST] 0 [115394] LOG:  invalid record length at 10/800000A0: wanted 24, got 0
2021-10-30 18:14:41.909281T  @  walreceiver  XX000[2021-10-30 18:14:41 CST] 0 [158899] FATAL:  could not connect to the primary server: server closed the connection unexpectedly
        This probably means the server terminated abnormally
        before or while processing the request.
2021-10-30 18:14:46.909030T  @  walreceiver  00000[2021-10-30 18:14:46 CST] 0 [158962] LOG:  started streaming WAL from primary at 10/80000000 on timeline 3
2021-10-30 18:15:30.175149T  @  checkpointer  00000[2021-10-29 20:45:28 CST] 0 [115395] LOG:  restartpoint starting: time
- repmgrd守护进程启动与停止。
- 主备切换。本质上是从节点promote的过程。只不过这个过程是去正常停止主节点。同样timineline会发生增加。如下:
此时新从节点的wal也是一样的。partial文件是因为promote发生在此时,所以其内容也被拷贝到了新timeline。
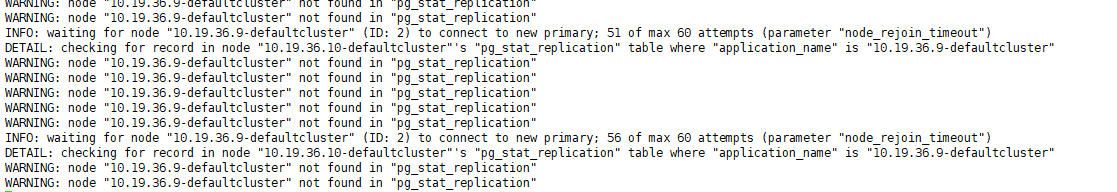
- 故障恢复。主节点修复后,如果能够正常rejoin回来固然好,更多的时候是rejoin失败(这通常发生在failover后,从promote为新主,然后不停地写写写,之后老主rejoin(立刻rejoin几乎都没有问题))。如下:
[lightdb@hs-10-19-36-9 log]$ repmgr node rejoin -f /home/lightdb/lightdb-x/13.3-21.2/etc/repmgr/repmgr.conf -d 'host=10.19.36.10 dbname=repmgr user=repmgr'
ERROR: this node cannot attach to rejoin target node 1
DETAIL: rejoin target server's timeline 6 forked off current database system timeline 5 before current recovery point 8/C00000A0
HINT: use --force-rewind to execute lt_rewind
[lightdb@hs-10-19-36-9 log]$ repmgr node rejoin -f /home/lightdb/lightdb-x/13.3-21.2/etc/repmgr/repmgr.conf -d 'host=10.19.36.10 dbname=repmgr user=repmgr' --force-rewind
NOTICE: lt_rewind execution required for this node to attach to rejoin target node 1
DETAIL: rejoin target server's timeline 6 forked off current database system timeline 5 before current recovery point 8/C00000A0
NOTICE: executing lt_rewind
DETAIL: lt_rewind command is "/home/lightdb/lightdb-x/13.3-21.2/bin/lt_rewind -D '/home/lightdb/data/defaultCluster' --source-server='host=10.19.36.10 port=5432 user=repmgr dbname=repmgr connect_timeout=2'"
ERROR: lt_rewind execution failed
DETAIL: lt_rewind: servers diverged at WAL location 8/A0000000 on timeline 5
lt_rewind: error: could not open file "/home/lightdb/data/defaultCluster/pg_wal/000000050000000800000004": 没有那个文件或目录
lt_rewind: fatal: could not find previous WAL record at 8/8DF84C18
可以看下新主节点或failed的老节点wal目录下是否包含该文件,有的话都拷贝过来(一般都有)。然后,重新执行rejoin。
[lightdb@lightdb1 data]$ repmgr node rejoin -d 'host=10.20.137.42 dbname=repmgr user=repmgr' -f /mnt/pmem1/lightdb/lightdb-x/13.3-21.2/etc/repmgr/repmgr.conf --force-rewind
NOTICE: lt_rewind execution required for this node to attach to rejoin target node 2
DETAIL: rejoin target server's timeline 6 forked off current database system timeline 5 before current recovery point 23/C0000028
### 正确的废话解释是:a standby server was promoted before it could catch up with the primary, and now the primary cannot take the role of a standby server
https://www.postgresql.org/message-id/5211C82B.2080605%40vmware.com 提了个bug,但是似乎没有给出充分答案

NOTICE: executing lt_rewind
DETAIL: lt_rewind command is "/mnt/pmem1/lightdb/lightdb-x/13.3-21.2/bin/lt_rewind -D '/mnt/pmem1/lightdb/data' --source-server='host=10.20.137.42 port=5432 user=repmgr dbname=repmgr connect_timeout=2'"
NOTICE: 0 files copied to /mnt/pmem1/lightdb/data
NOTICE: setting node 1's upstream to node 2
WARNING: unable to ping "host=10.20.137.41 port=5432 user=repmgr dbname=repmgr connect_timeout=2"
DETAIL: PQping() returned "PQPING_NO_RESPONSE"
NOTICE: starting server using "/mnt/pmem1/lightdb/lightdb-x/13.3-21.2/bin/lt_ctl  -w -D '/mnt/pmem1/lightdb/data' start"
WARNING: unable to ping "host=10.20.137.41 port=5432 user=repmgr dbname=repmgr connect_timeout=2"
DETAIL: PQping() returned "PQPING_NO_RESPONSE"
WARNING: unable to ping "host=10.20.137.41 port=5432 user=repmgr dbname=repmgr connect_timeout=2"
DETAIL: PQping() returned "PQPING_NO_RESPONSE"
INFO: waiting for node "10.19.69.192-defaultcluster" (ID: 1) to respond to pings; 56 of max 60 attempts (parameter "node_rejoin_timeout")
WARNING: unable to ping "host=10.19.69.192 port=5433 user=repmgr dbname=repmgr connect_timeout=2"
DETAIL: PQping() returned "PQPING_REJECT"
WARNING: unable to ping "host=10.19.69.192 port=5433 user=repmgr dbname=repmgr connect_timeout=2"
DETAIL: PQping() returned "PQPING_REJECT"
WARNING: unable to ping "host=10.19.69.192 port=5433 user=repmgr dbname=repmgr connect_timeout=2"
DETAIL: PQping() returned "PQPING_REJECT"
WARNING: unable to ping "host=10.19.69.192 port=5433 user=repmgr dbname=repmgr connect_timeout=2"
DETAIL: PQping() returned "PQPING_REJECT"
ERROR: NODE REJOIN failed
DETAIL: local node "10.19.69.192-defaultcluster" did not become available start after 60 seconds
HINT: check the LightDB log on the local node
问题在于rejoin看起来好像执行成功了,但是实例还是启动失败(已经--force-rewind)。pg.log对应日志如下:
2021-10-30 23:46:06.436515T  @  startup  00000[2021-10-30 23:46:06 CST] 0 [139358] LOG:  database system was interrupted while in recovery at log time 2021-10-30 23:10:42 CST
2021-10-30 23:46:06.436515T  @  startup  00000[2021-10-30 23:46:06 CST] 0 [139358] HINT:  If this has occurred more than once some data might be corrupted and you might need to choose an earlier recovery target.
2021-10-30 23:46:06.459085T  @  startup  00000[2021-10-30 23:46:06 CST] 0 [139358] LOG:  entering standby mode
2021-10-30 23:46:06.459218T  @  startup  XX000[2021-10-30 23:46:06 CST] 0 [139358] FATAL:  requested timeline 6 does not contain minimum recovery point 2A/687352C8 on timeline 4
2021-10-30 23:46:06.460032T  @  postmaster  00000[2021-10-30 23:46:05 CST] 0 [139356] LOG:  startup process (PID 139358) exited with exit code 1
2021-10-30 23:46:06.460061T  @  postmaster  00000[2021-10-30 23:46:05 CST] 0 [139356] LOG:  aborting startup due to startup process failure
2021-10-30 23:46:06.461174T  @  postmaster  00000[2021-10-30 23:46:05 CST] 0 [139356] LOG:  database system is shut down
确定的是:新主的timeline id是5,为什么最小恢复点需要4呢?因为pg_rewind是从失败节点的wal文件中去找新主timeline fork off之前的那个full checkpoint,然后根据全量检查点之后的WAL找到新主之后修改过的block,这样就可以做增量恢复了。
也可能是下列错误:
2021-11-04 22:40:44.695099T  @  walreceiver  00000[2021-11-04 22:40:44 CST] 0 [5559] LOG:  started streaming WAL from primary at 3/60000000 on timeline 2
2021-11-04 22:40:44.695197T  @  walreceiver  XX000[2021-11-04 22:40:44 CST] 0 [5559] FATAL:  could not receive data from WAL stream: ERROR:  requested WAL segment 000000020000000300000003 has already been removed
2021-11-04 22:40:45.249731T host_10_19_69_193 repmgr@repmgr 10.19.69.192(40182) client backend  57P03[2021-11-04 22:40:45 CST] 0 [5560] FATAL:  the database system is starting up
2021-11-04 22:40:45.250723T host_10_19_69_193 repmgr@repmgr 10.19.69.192(40184) client backend  57P03[2021-11-04 22:40:45 CST] 0 [5561] FATAL:  the database system is starting up
2021-11-04 22:40:47.258559T host_10_19_69_193 repmgr@repmgr 10.19.69.192(40188) client backend  57P03[2021-11-04 22:40:47 CST] 0 [5564] FATAL:  the database system is starting up
2021-11-04 22:40:47.259607T host_10_19_69_193 repmgr@repmgr 10.19.69.192(40190) client backend  57P03[2021-11-04 22:40:47 CST] 0 [5565] FATAL:  the database system is starting up
2021-11-04 22:40:49.267843T host_10_19_69_193 repmgr@repmgr 10.19.69.192(40194) client backend  57P03[2021-11-04 22:40:49 CST] 0 [5567] FATAL:  the database system is starting up
2021-11-04 22:40:49.268930T host_10_19_69_193 repmgr@repmgr 10.19.69.192(40196) client backend  57P03[2021-11-04 22:40:49 CST] 0 [5568] FATAL:  the database system is starting up
2021-11-04 22:40:49.700288T  @  walreceiver  00000[2021-11-04 22:40:49 CST] 0 [5570] LOG:  started streaming WAL from primary at 3/60000000 on timeline 2
2021-11-04 22:40:49.700369T  @  walreceiver  XX000[2021-11-04 22:40:49 CST] 0 [5570] FATAL:  could not receive data from WAL stream: ERROR:  requested WAL segment 000000020000000300000003 has already been removed
这通常是由于原从节点(新主节点)配置不正确,在WAL没有归档之前被删除了。
如果确定无论如何都找不到WAL了,那只能通过clone重新初始化。
repmgr -h 10.19.69.193 -U repmgr -d repmgr -f lightdb/lightdb-x/13.3-21.2/etc/repmgr/repmgr.conf standby clone --dry-run
repmgr -h 10.19.69.193 -U repmgr -d repmgr -f lightdb/lightdb-x/13.3-21.2/etc/repmgr/repmgr.conf standby clone -F
repmgr -f lightdb/lightdb-x/13.3-21.2/etc/repmgr/repmgr.conf standby register -F
lt_ctl start
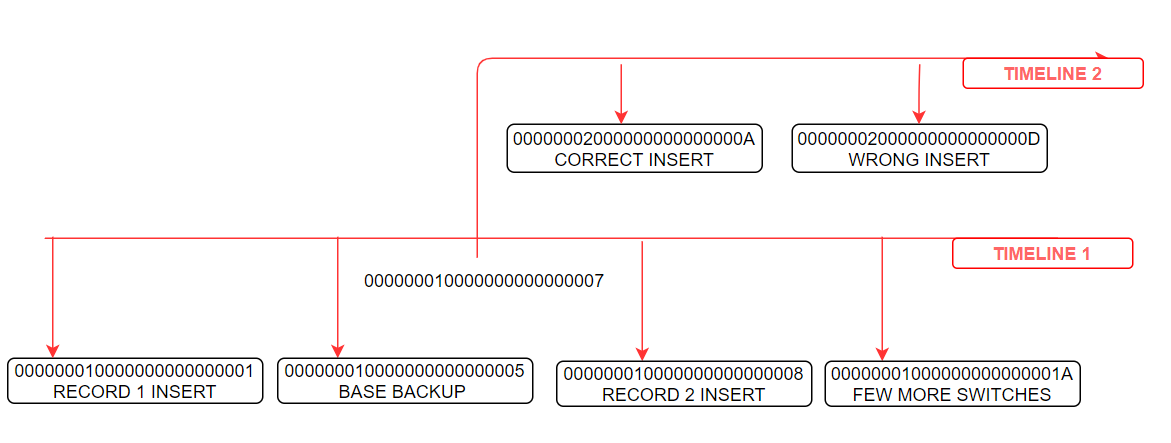
注:补充一下,Pg的timeline,准确的说和oracle的resetlogs是一样的。相当于重新初始化的实例。wal文件的前8位就是timeline id。每次发生基于时间点的恢复或pg_rewind、promote,即进入ArchiveRecovery模式(只要出现recovery.signal或standby.signal都会设置改参数),timeline id都会加1,并且会生成一个NewTimelineID.history文件。所以第一个history文件是00000002.history。在时间点恢复(参数recovery_target_timeline和recovery_target_lsn控制)的情况下,hisotry文件会记录设置的恢复点和实际的恢复点。如下:
cat 00000002.history
1 0/70000D8 after LSN 0/7000060

含义如下:
1<parentTLI>    0/70000D8 <switchpoint>     after LSN 0/7000060<reason>

parentTLI:    ID of the parent timeline
switchpoint:    XLogRecPtr of the WAL location where the switch happened
reason :    human-readable explanation of why the timeline was changed
所以多次时间点恢复后可能是上面这样的。
或者如下:
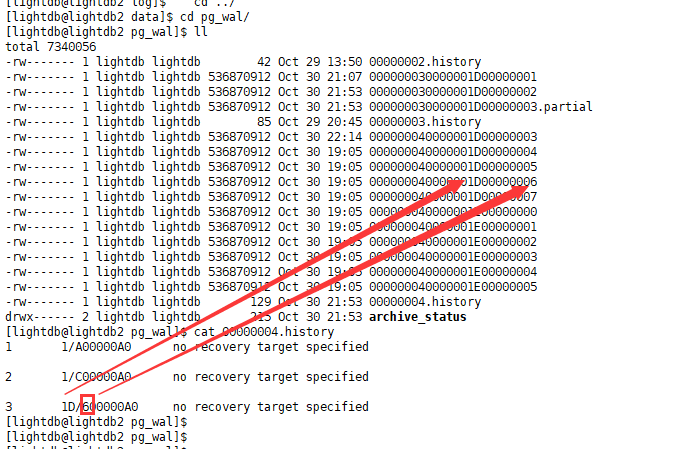
查看pg_wal,可以发现最旧的文件已经是从00004开始了。
[lightdb@hs-10-19-36-9 defaultCluster]$ cd /home/lightdb/data/defaultCluster/pg_wal
[lightdb@hs-10-19-36-9 pg_wal]$ ll
总用量 13107224
-rw------- 1 lightdb lightdb       333 10月 29 11:19 000000010000000000000002.00000028.backup
-rw------- 1 lightdb lightdb        42 10月 29 12:13 00000002.history
-rw------- 1 lightdb lightdb        85 10月 29 14:02 00000003.history
-rw------- 1 lightdb lightdb       128 10月 29 15:49 00000004.history
-rw------- 1 lightdb lightdb 536870912 10月 29 23:12 000000050000000800000005
-rw------- 1 lightdb lightdb 536870912 10月 29 23:12 000000050000000800000006
-rw------- 1 lightdb lightdb 536870912 10月 29 22:39 000000050000000800000007
-rw------- 1 lightdb lightdb 536870912 10月 29 22:42 000000050000000900000000
-rw------- 1 lightdb lightdb 536870912 10月 29 22:44 000000050000000900000001
-rw------- 1 lightdb lightdb 536870912 10月 29 22:46 000000050000000900000002
-rw------- 1 lightdb lightdb 536870912 10月 29 22:47 000000050000000900000003
-rw------- 1 lightdb lightdb 536870912 10月 29 22:54 000000050000000900000004
-rw------- 1 lightdb lightdb 536870912 10月 29 22:49 000000050000000900000005
-rw------- 1 lightdb lightdb 536870912 10月 29 22:52 000000050000000900000006
-rw------- 1 lightdb lightdb 536870912 10月 29 23:03 000000050000000900000007
-rw------- 1 lightdb lightdb 536870912 10月 29 22:39 000000050000000A00000000
-rw------- 1 lightdb lightdb 536870912 10月 29 22:39 000000050000000A00000001
-rw------- 1 lightdb lightdb 536870912 10月 29 22:40 000000050000000A00000002
-rw------- 1 lightdb lightdb 536870912 10月 29 22:41 000000050000000A00000003
-rw------- 1 lightdb lightdb 536870912 10月 29 22:43 000000050000000A00000004
-rw------- 1 lightdb lightdb 536870912 10月 29 22:46 000000050000000A00000005
-rw------- 1 lightdb lightdb 536870912 10月 29 22:48 000000050000000A00000006
-rw------- 1 lightdb lightdb 536870912 10月 29 22:51 000000050000000A00000007
-rw------- 1 lightdb lightdb 536870912 10月 29 22:40 000000050000000B00000000
-rw------- 1 lightdb lightdb 536870912 10月 29 22:41 000000050000000B00000001
-rw------- 1 lightdb lightdb 536870912 10月 29 22:43 000000050000000B00000002
-rw------- 1 lightdb lightdb 536870912 10月 29 22:45 000000050000000B00000003
-rw------- 1 lightdb lightdb 536870912 10月 29 22:50 000000050000000B00000004
-rw------- 1 lightdb lightdb 536870912 10月 29 22:53 000000050000000B00000005
-rw------- 1 lightdb lightdb       171 10月 29 16:04 00000005.history
-rw------- 1 lightdb lightdb       214 10月 29 23:12 00000006.history
drwx------ 2 lightdb lightdb       242 10月 29 23:12 archive_status
PS:wal文件的命名格式是:3部分8位16进制,从00000001 00000000 00000001开始,如:00000001(timelineid) 0000000C(logNo, lsn/(0x100000000/wal_segsz_bytes)) 000000CE(segNo, lsn % (0x100000000/wal_segsz_bytes))。所以wal文件名的生成是有体系的,根据wal大小不同,第三部分可能不同,并非简单的x/yyZZZZZZ中的yy。
0x100000000=4 294,967,296,无论wal_segsz_bytes多大,logNo每4GB加1,segNo数量不确定。
看下各个history文件的内容。
[lightdb@hs-10-19-36-9 pg_wal]$ tail -fn 100 00000005.history
1    0/800000A0    no recovery target specified    # 表示没有声明任何recovery_target相关参数,在xlog.c的7611行else逻辑中。

2    0/A00000A0    no recovery target specified

3    4/C00000A0    no recovery target specified

4    4/E00000A0    no recovery target specified
^C
[lightdb@hs-10-19-36-9 pg_wal]$ cat 00000005.history
1    0/800000A0    no recovery target specified

2    0/A00000A0    no recovery target specified

3    4/C00000A0    no recovery target specified

4    4/E00000A0    no recovery target specified
[lightdb@hs-10-19-36-9 pg_wal]$ cat 00000004.history
1    0/800000A0    no recovery target specified

2    0/A00000A0    no recovery target specified

3    4/C00000A0    no recovery target specified
[lightdb@hs-10-19-36-9 pg_wal]$ cat 00000003.history
1    0/800000A0    no recovery target specified

2    0/A00000A0    no recovery target specified
[lightdb@hs-10-19-36-9 pg_wal]$ cat 00000006.history
1    0/800000A0    no recovery target specified

2    0/A00000A0    no recovery target specified

3    4/C00000A0    no recovery target specified

4    4/E00000A0    no recovery target specified

5    8/A0000000    no recovery target specified
故障恢复问题2,除了上述场景外,故障恢复还可能发生下列情况。主备的repmgr一直在尝试连接挂掉的新节点,就是没有执行failover。
[2021-10-30 23:02:01] [WARNING] unable to ping "host=10.20.137.42 port=5432 user=repmgr dbname=repmgr connect_timeout=2"
[2021-10-30 23:02:01] [DETAIL] PQping() returned "PQPING_NO_RESPONSE"
[2021-10-30 23:02:01] [WARNING] connection to node "10.20.137.42-defaultcluster" (ID: 2) lost
[2021-10-30 23:02:01] [DETAIL]
connection pointer is NULL

[2021-10-30 23:02:01] [INFO] attempting to reconnect to node "10.20.137.42-defaultcluster" (ID: 2)
[2021-10-30 23:02:01] [ERROR] connection to database failed
[2021-10-30 23:02:01] [DETAIL]
could not connect to server: Connection refused
    Is the server running on host "10.20.137.42" and accepting
    TCP/IP connections on port 5432?

[2021-10-30 23:02:01] [DETAIL] attempted to connect using:
  user=repmgr connect_timeout=2 dbname=repmgr host=10.20.137.42 port=5432 fallback_application_name=repmgr options=-csearch_path=
[2021-10-30 23:02:01] [WARNING] reconnection to node "10.20.137.42-defaultcluster" (ID: 2) failed
[2021-10-30 23:02:01] [WARNING] unable to ping "host=10.20.137.42 port=5432 user=repmgr dbname=repmgr connect_timeout=2"
[2021-10-30 23:02:01] [DETAIL] PQping() returned "PQPING_NO_RESPONSE"
[2021-10-30 23:02:01] [ERROR] unable to determine if server is in recovery
[2021-10-30 23:02:01] [DETAIL] query text is:
SELECT pg_catalog.pg_is_in_recovery()
[2021-10-30 23:02:01] [WARNING] unable to determine node recovery status
如果没有配置witness的话,这个时候要检查一下repmgr服务是否在pause状态。如果pause状态,是不会failover的(95%的概率)。