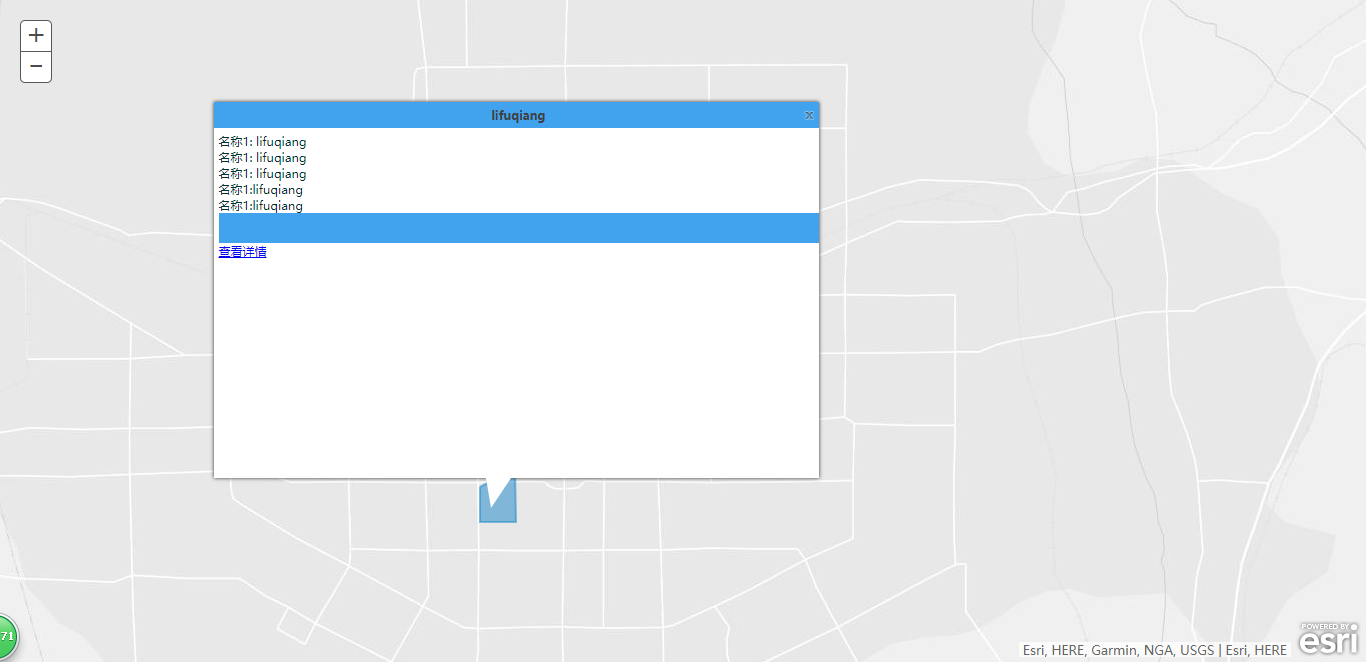
arcgis 自己的infowindow 太难看了,放在系统中与系统中的风格格格不入,在参考了网上的一些资料后,整理编写了适合自己系统的infowindow,与大家分享。
1、自定义展示效果
2、InfoWindow.js
define([
"dojo/Evented",
"dojo/parser",
"dojo/on",
"dojo/_base/declare",
"dojo/dom-construct",
"dojo/_base/array",
"dojo/dom-style",
"dojo/_base/lang",
"dojo/dom-class",
"dojo/fx",
"dojo/Deferred",
"esri/domUtils",
"esri/InfoWindowBase"
],
function(
Evented,
parser,
on,
declare,
domConstruct,
array,
domStyle,
lang,
domClass,
coreFx,
Deferred,
domUtils,
InfoWindowBase
)
{
var infoWidth,infoHeight;
var initMapCenter,initScreenCenter;
var showMapPoint,showScreenPoint=null;
return declare([InfoWindowBase, Evented],
{
constructor: function(parameters)
{
lang.mixin(this, parameters);
domClass.add(this.domNode, "myInfoWindow");
this._closeButton = domConstruct.create("div",{"class": "close", "title": "关闭"}, this.domNode);
this._title = domConstruct.create("div",{"class": "title"}, this.domNode);
this._content = domConstruct.create("div",{"class": "content"}, this.domNode);
this._arrow = domConstruct.create("div",{"class": "arrow"}, this.domNode);
on(this._closeButton, "click", lang.hitch(this, function(){
//hide the content when the info window is toggled close.
this.hide();
}));
//hide initial display
domUtils.hide(this.domNode);
this.isShowing = false;
},
setMap: function(map)
{
this.inherited(arguments);
map.on("pan", lang.hitch(this, function(pan){
var movePoint=pan.delta;
if(this.isShowing)
{
if(showScreenPoint!=null)
{
this._showInfoWindow(showScreenPoint.x+movePoint.x,showScreenPoint.y+movePoint.y);
}
}
}));
map.on("pan-end", lang.hitch(this, function(panend){
var movedelta=panend.delta;
if(this.isShowing){
showScreenPoint.x=showScreenPoint.x+movedelta.x;
showScreenPoint.y=showScreenPoint.y+movedelta.y;
}
}));
map.on("zoom-start", lang.hitch(this, function(){
domUtils.hide(this.domNode);
this.onHide();
}));
map.on("zoom-end", lang.hitch(this, function(){
if(this.isShowing){
showScreenPoint=this.map.toScreen(showMapPoint);
this._showInfoWindow(showScreenPoint.x,showScreenPoint.y);
}
}));
},
setTitle: function(title){
this.place(title, this._title);
},
setContent: function(content){
this.place(content, this._content);
},
_showInfoWindow:function(x,y)
{
//Position 10x10 pixels away from the specified location
domStyle.set(this.domNode,{
"left": x - infoWidth/2 + 25 + "px",
"top": y - infoHeight-30 + "px"
});
//display the info window
domUtils.show(this.domNode);
},
show: function(location)
{
showMapPoint=location;
initMapCenter=this.map.extent.getCenter();
initScreenCenter=this.map.toScreen(initMapCenter);
infoHeight= $(".myInfoWindow").height();
infoWidth= $(".myInfoWindow").width();
if(location.spatialReference){
location = this.map.toScreen(location);
}
var left=location.x-infoWidth/2;
var top=location.y-infoHeight-35;
showScreenPoint=location;
if(top<5)
{
initScreenCenter.y=initScreenCenter.y+top-5;
}
if(left<5)
{
initScreenCenter.x=initScreenCenter.x+left-5;
}
this._showInfoWindow(showScreenPoint.x,showScreenPoint.y);
initMapCenter=this.map.toMap(initScreenCenter);
this.map.centerAt(initMapCenter);
this.isShowing = true;
this.onShow();
},
hide: function(){
domUtils.hide(this.domNode);
this.isShowing = false;
this.onHide();
},
resize: function(width, height){
domStyle.set(this._content,{
"width": width + "px",
"height": (height-60) + "px"
});
domStyle.set(this._title,{
"width": width + "px"
});
},
destroy: function(){
domConstruct.destroy(this.domNode);
this._closeButton = this._title = this._content = null;
}
});
return InfoWindow;
});
3、InfoWindow.css
.myInfoWindow {
position: absolute;
z-index: 100;
font-family: sans-serif;
font-size: 12px;
box-shadow: 0px 0px 5px 0px #2F302C;
}
.dj_ie .myInfoWindow {
border: 1px solid black;
}
.myInfoWindow .content {
position: relative;
background-color:#fff;
color:#002F2F;
overflow: auto;
padding-top:5px;
padding-bottom:5px;
padding-left:5px;
}
.myInfoWindow .arrow {
position: absolute;
0px;
height: 0px;
line-height: 0px;/*为了防止ie下出现题型*/
border-top: 30px solid #fff;
border-left: 5px solid transparent;
border-right: 20px solid transparent;
left: 45%;
bottom: -30px;
}
.myInfoWindow .close {
position: absolute; top: 7px; right: 5px;
cursor: pointer;
background: url(http://serverapi.arcgisonline.com/jsapi/arcgis/2.6/js/dojo/dijit/themes/claro/layout/images/tabClose.png) no-repeat scroll 0px 0px transparent;
12px; height: 12px;
}
.myInfoWindow .close:hover {
background-color: #F7FCFF;
}
.myInfoWindow .title {
font-weight: bold;
background-color: #41A3EE;
color: #404040;
padding-top: 5px;
padding-bottom: 5px;
padding-left: 5px;
text-align: center;
}
4.index.html(测试页面)
<!DOCTYPE html>
<html>
<head>
<meta http-equiv="Content-Type" content="text/html; charset=utf-8"/>
<!--The viewport meta tag is used to improve the presentation and behavior
of the samples on iOS devices-->
<meta name="viewport" content="initial-scale=1, maximum-scale=1,user-scalable=no">
<title>Custom Info Window</title>
<link rel="stylesheet" href="http://js.arcgis.com/3.14/esri/css/esri.css">
<link rel="stylesheet" href="myModules/InfoWindow.css">
<style>
html, body, #mapDiv { height: 100%; 100%; margin: 0; padding: 0; }
</style>
<script>
var dojoConfig = {
parseOnLoad:true,
packages: [{
"name": "myModules",
"location": location.pathname.replace(//[^/]+$/, "") + "/myModules"
}]
};
</script>
<script src="http://js.arcgis.com/3.14/init.js"></script>
<script src="jquery.min.js"></script>
<script>
require([
"dojo/dom",
"dojo/dom-construct",
"esri/map",
"myModules/InfoWindow",
"esri/layers/FeatureLayer",
"esri/InfoTemplate",
"dojo/string",
"dojo/domReady!"
], function(
dom,
domConstruct,
Map,
InfoWindow,
FeatureLayer,
InfoTemplate,
string
) {
//create the custom info window specifying any input options
var infoWindow = new InfoWindow({
domNode: domConstruct.create("div", null, dom.byId("mapDiv"))
});
var map = new Map("mapDiv", {
basemap: "gray",
center: [108.954238, 34.265472],
zoom: 12,
infoWindow: infoWindow
});
var showGraphicLayer = new esri.layers.GraphicsLayer();
map.addLayer(showGraphicLayer);
map.on("load", createToolbarAndContextMenu);
function createToolbarAndContextMenu() {
var polygonSymbol = new esri.symbol.SimpleFillSymbol(esri.symbol.SimpleFillSymbol.STYLE_SOLID,
new esri.symbol.SimpleLineSymbol(esri.symbol.SimpleLineSymbol.STYLE_SOLID, new esri.Color([25, 132, 200, 0.5]), 2),
new esri.Color([25, 132, 200, 0.5]));
var ring = "[108.92796875049564, 34.25199473286298],[108.93398402791837, 34.2547358719417],[108.93413631342275, 34.247045453970856],[108.92796875049564, 34.24696931121866], [108.92796875049564, 34.25199473286298]";
var polygon = new esri.geometry.Polygon({
"rings": eval('([[' + ring + ']])')
});
var attr = { "stationName": "lifuqiang", "locate": "lifuqiang", "complainTime": "lifuqiang", "region": "lifuqiang", "type": "lifuqiang", "technology": "lifuqiang" };
var infoTemplate = new esri.InfoTemplate("${stationName}", "名称1: ${locate}<br/>名称1: ${complainTime} <br/>名称1: ${region} <br/>名称1:${type}<br/>名称1:${technology}<div style='display:block;height:30px;background:#41A3EE;'></div><div><a href='javascript:ShowDetailStationPanel(22)'>查看详情</a> </div>");
var symbol;
var dddd = new esri.Graphic(polygon, polygonSymbol, attr, infoTemplate);
showGraphicLayer.add(dddd);
}
// var template = new esri.dijit.PopupTemplate({
// title: "Boston Marathon 2013",
// description: " of starters from finished",
// fieldInfos: [{ //define field infos so we can specify an alias
// fieldName: "Percent_Fi",
// label: "Entrants"
// },{
// fieldName: "Number_Sta",
// label: "Starters"
// },{
// fieldName: "Number_Fin",
// label: "Finishers"
// }]
// });
//var featureLayer = new FeatureLayer("http://services.arcgis.com/V6ZHFr6zdgNZuVG0/arcgis/rest/services/Boston_Marathon/FeatureServer/0",{
// mode: FeatureLayer.MODE_ONDEMAND,
// outFields: ["*"],
// infoTemplate:template
// });
// map.addLayer(featureLayer);
//resize the info window
map.infoWindow.resize(600, 400);
});
</script>
</head>
<body>
<div id="mapDiv"></div>
</body>
</html>
5、文件结构数
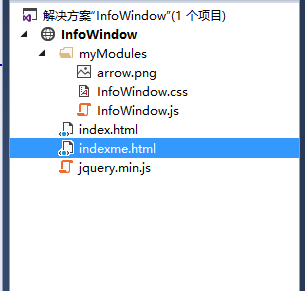
将2、3、4文件按照5的结构创建,点击浏览index.html,可见图1效果