prometheus部署+grafana部署+node-export监控使用
prometheus部署
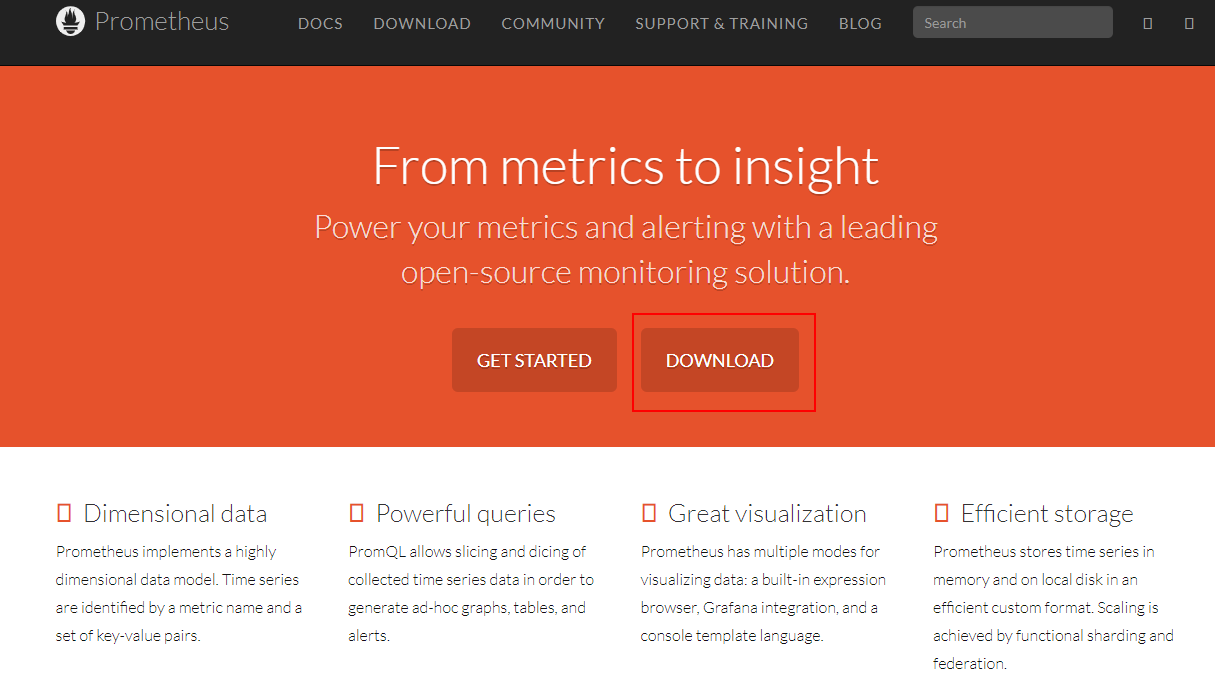
登录官网:https://prometheus.io/ ,找到下载页面
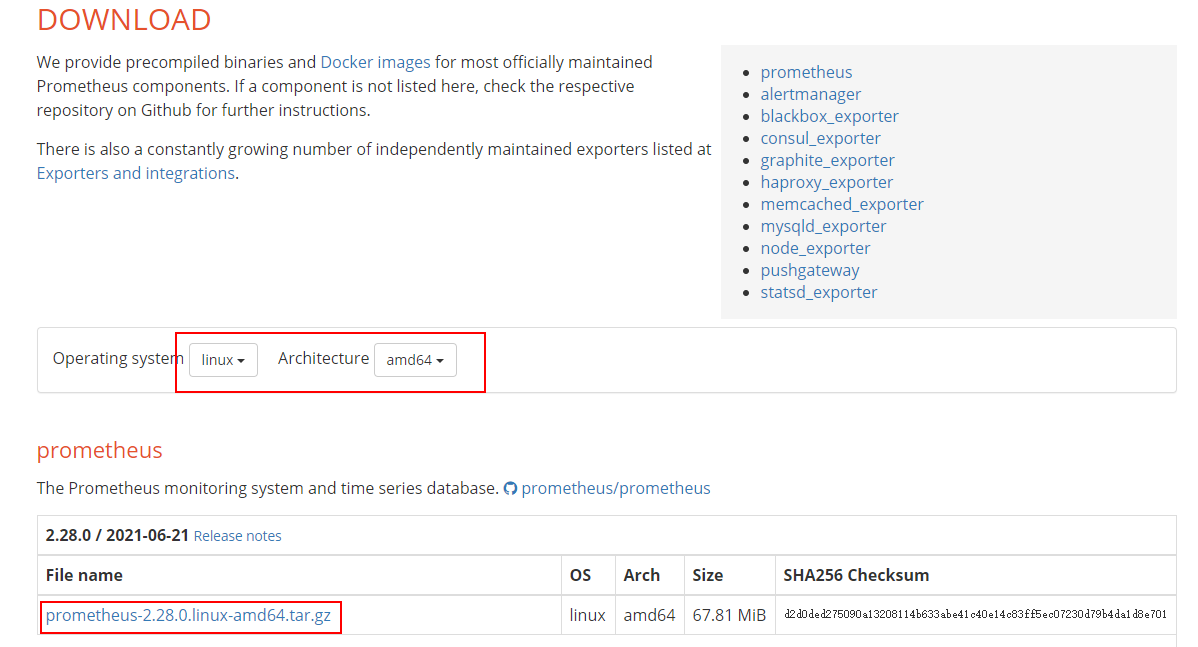
下载liunx版本(注意:x86系统使用amd安装包,pk系统使用arm安装包)
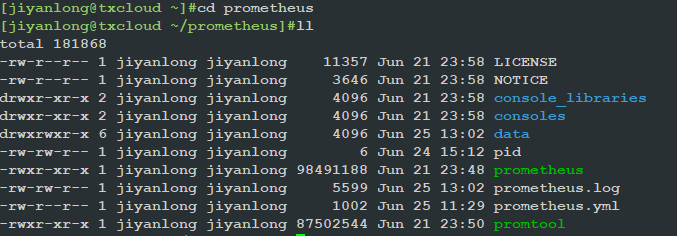
wget下载完毕使用tar命令解压
启动Prometheus
启用远程热加载配置文件
./prometheus --confing.file=prometheus.yml --web.enable-lifecycle
curl -X POST http://localhost:9090/-/reload
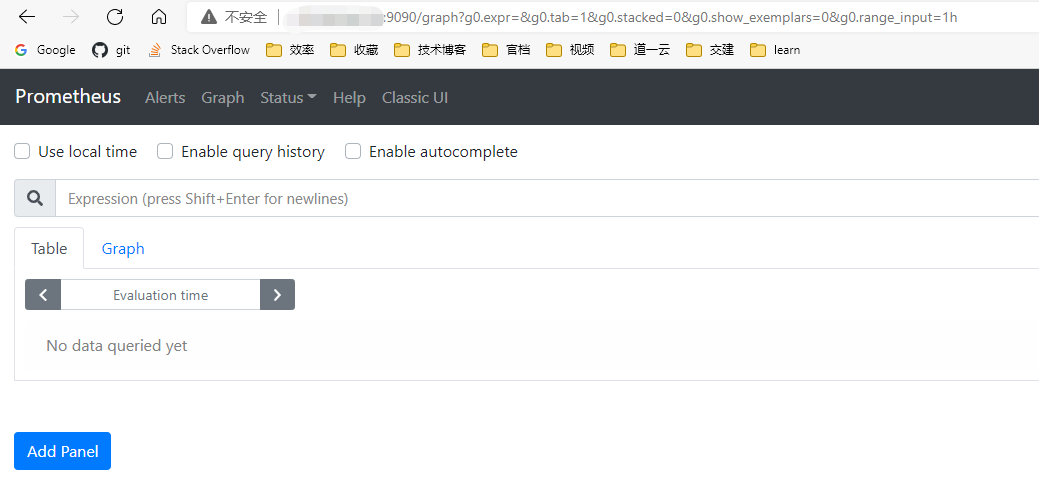
启动完毕后登录服务页面查看是否成功

#指定相关环境变量并使用nohup启动
prefix=/home/jiyanlong/prometheus
exec_prefix=${prefix}
prometheus_BIN=${exec_prefix}/prometheus
prometheus_LOG=${exec_prefix}/prometheus.log
prometheus_PID=${exec_prefix}/pid
nohup $prometheus_BIN --config.file="${exec_prefix}/prometheus.yml" --web.listen-address="0.0.0.0:9090" --storage.tsdb.path="${exec_prefix}/data" --storage.tsdb.retention=365d --web.enable-lifecycle > $prometheus_LOG 2>&1 &
grafana部署使用
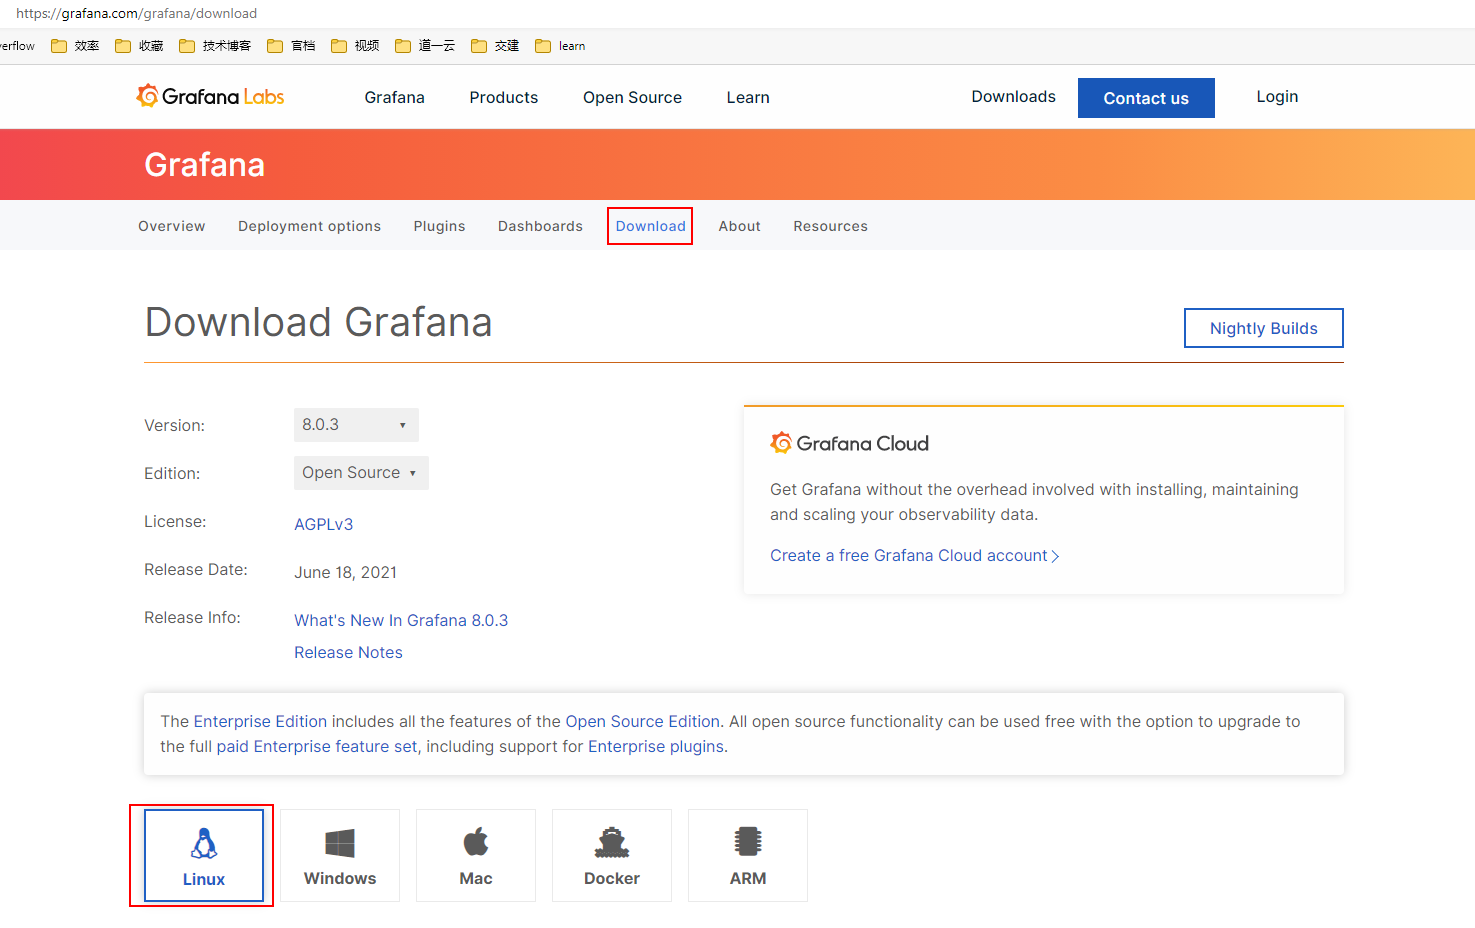
进入下载页面 https://grafana.com/grafana/download
sudo yum install grafana-8.0.3-1.x86_64.rpm
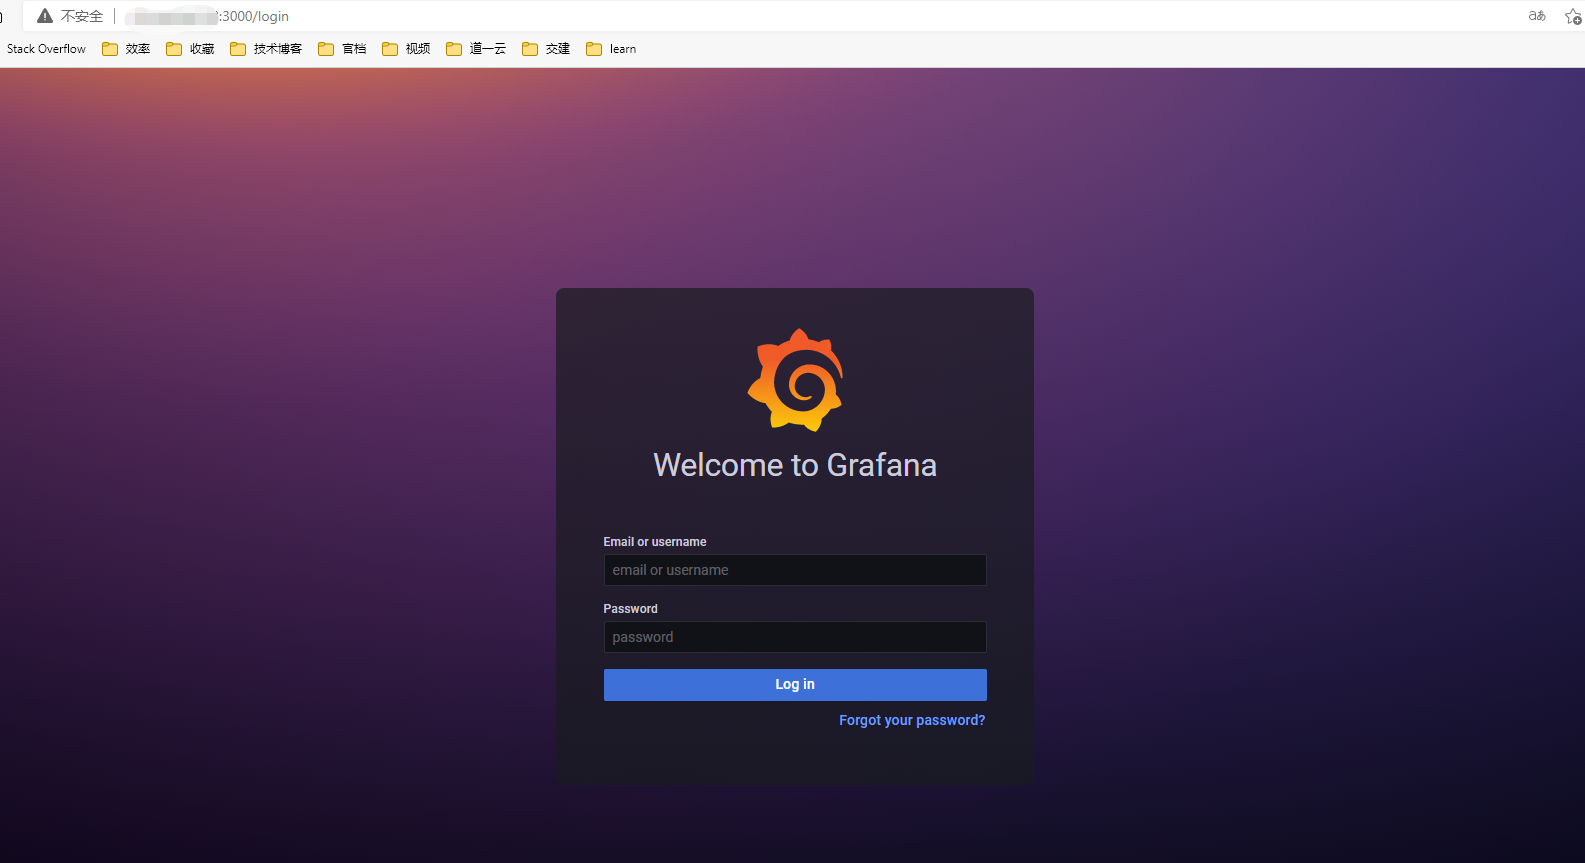
默认账号admin/admin
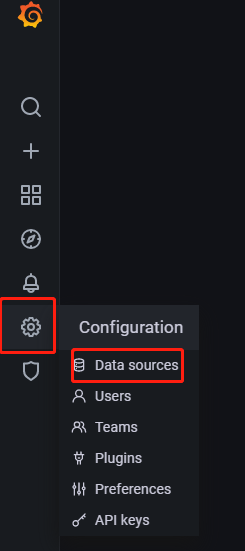
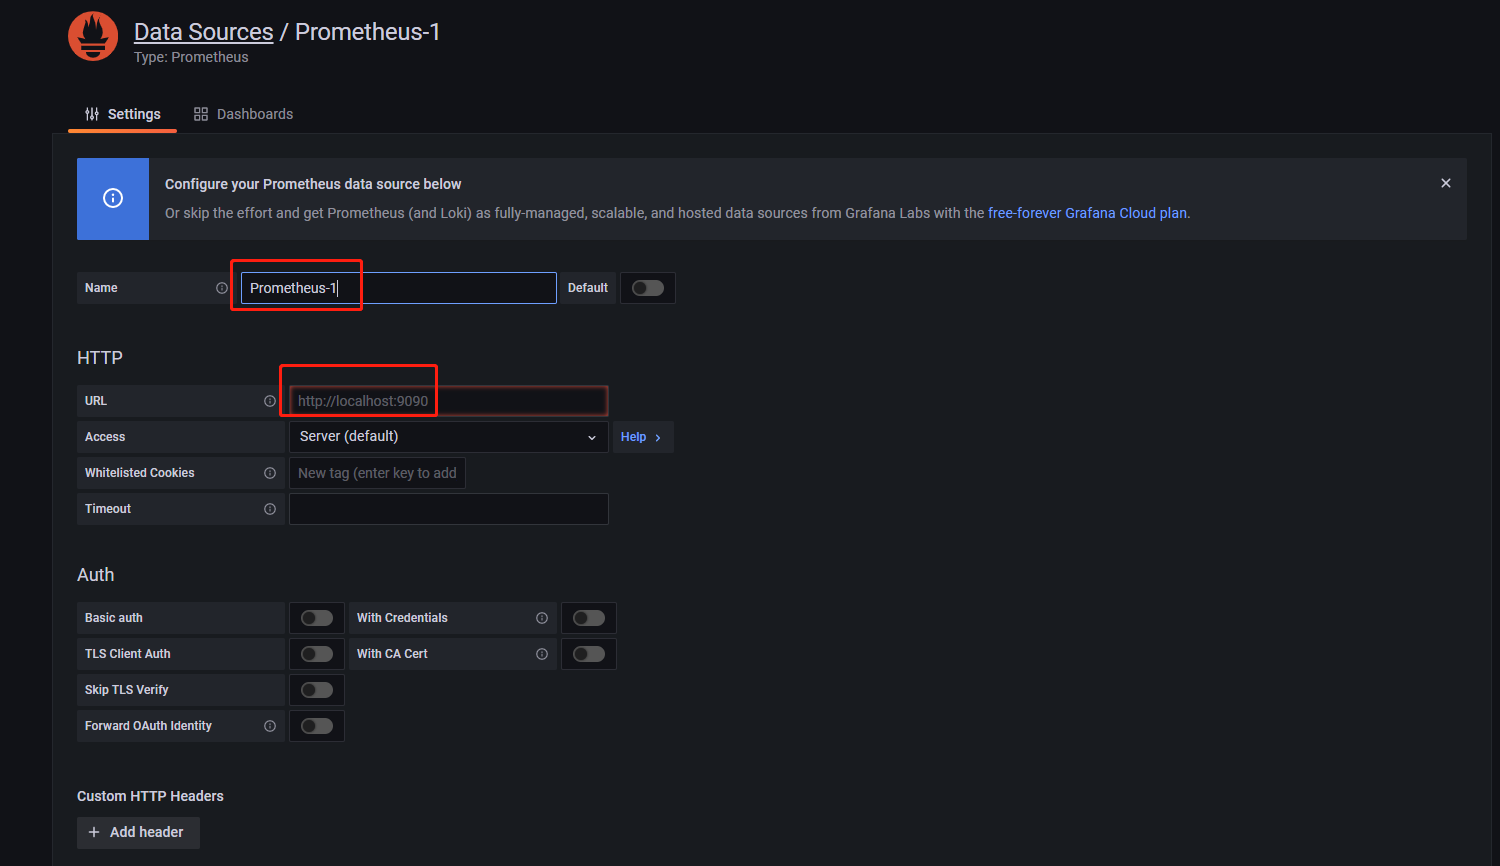
配置Prometheus数据源
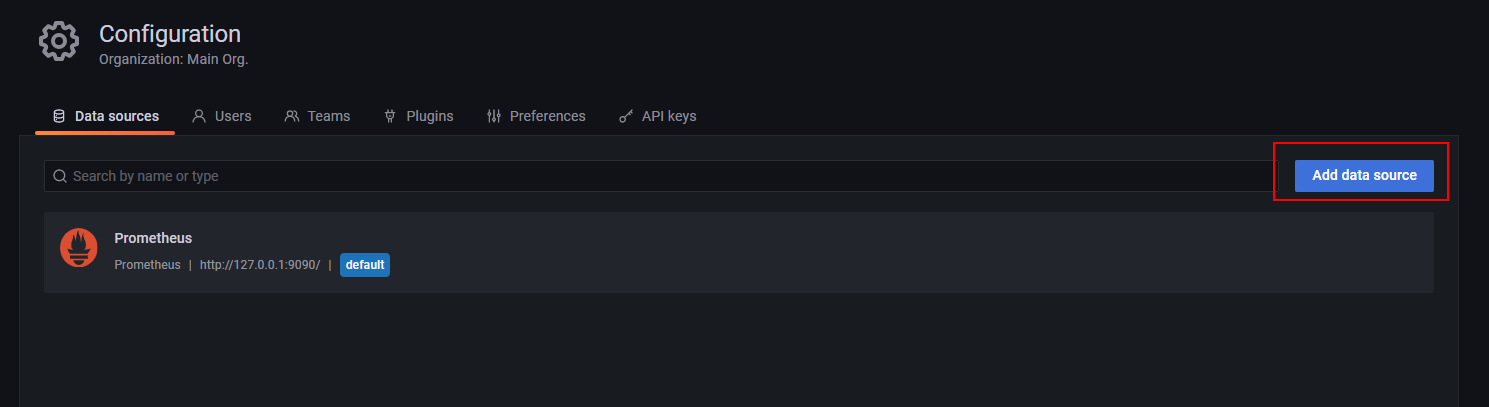
填写prometheus地址并保存
Linux服务器监控node_exporter部署
Prometheus可以从Kubernetes集群的各个组件中采集数据,比如kubelet中自带的cadvisor,api-server等,而node-export就是其中一种来源
Exporter是Prometheus的一类数据采集组件的总称。它负责从目标处搜集数据,并将其转化为Prometheus支持的格式。与传统的数据采集组件不同的是,它并不向中央服务器发送数据,而是等待中央服务器主动前来抓取,默认的抓取地址为http://CURRENT_IP:9100/metrics
node-exporter用于采集服务器层面的运行指标,包括机器的loadavg、filesystem、meminfo等基础监控,类似于传统主机监控维度的zabbix-agent
node-export由prometheus官方提供、维护,不会捆绑安装,但基本上是必备的exporter
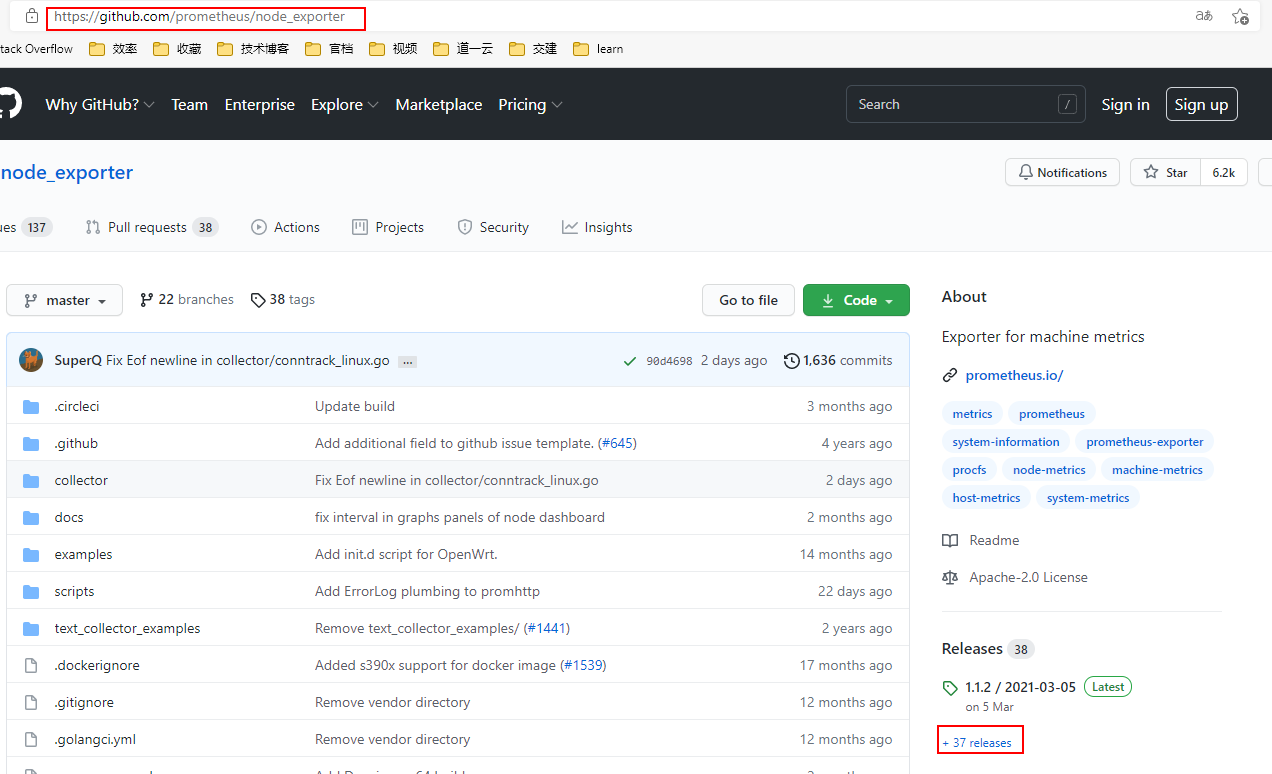
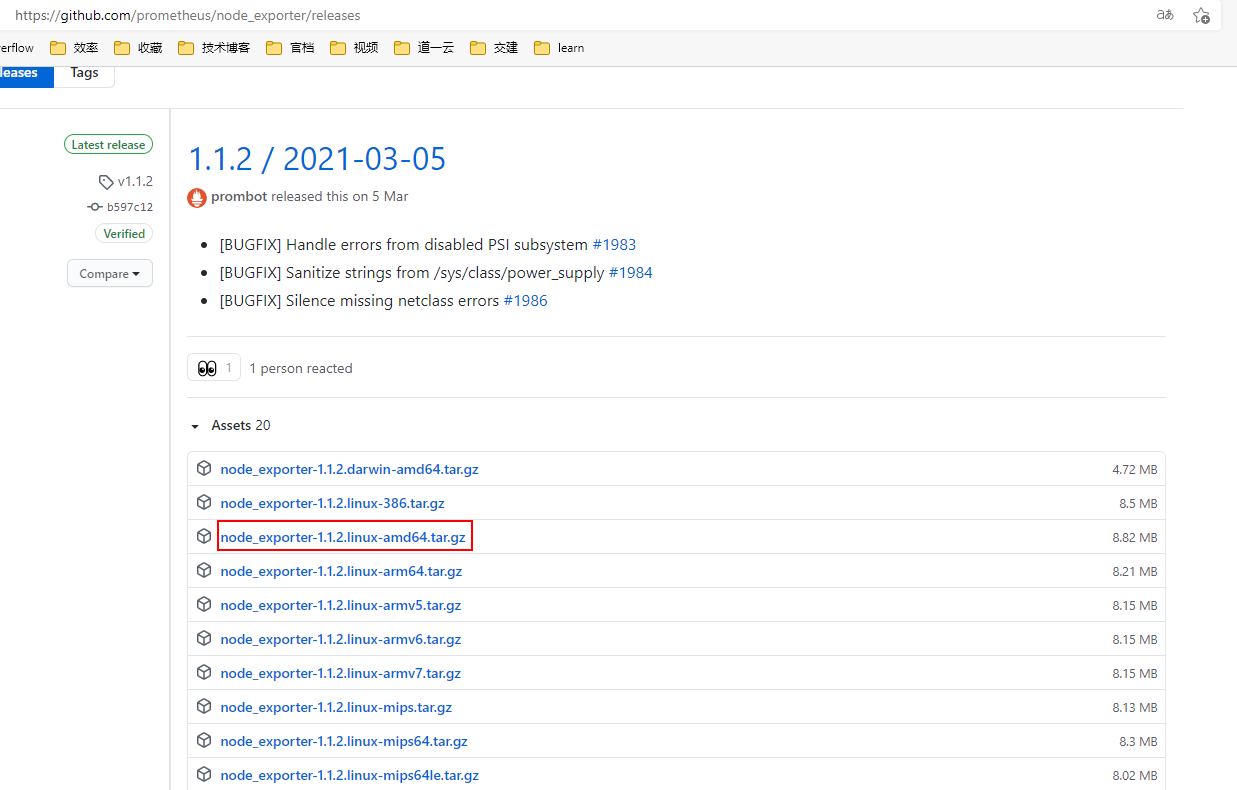
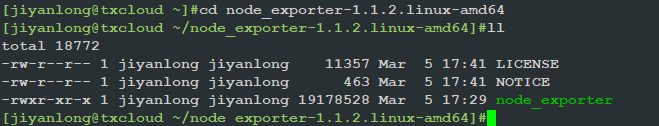
wget下载解压对应的版本
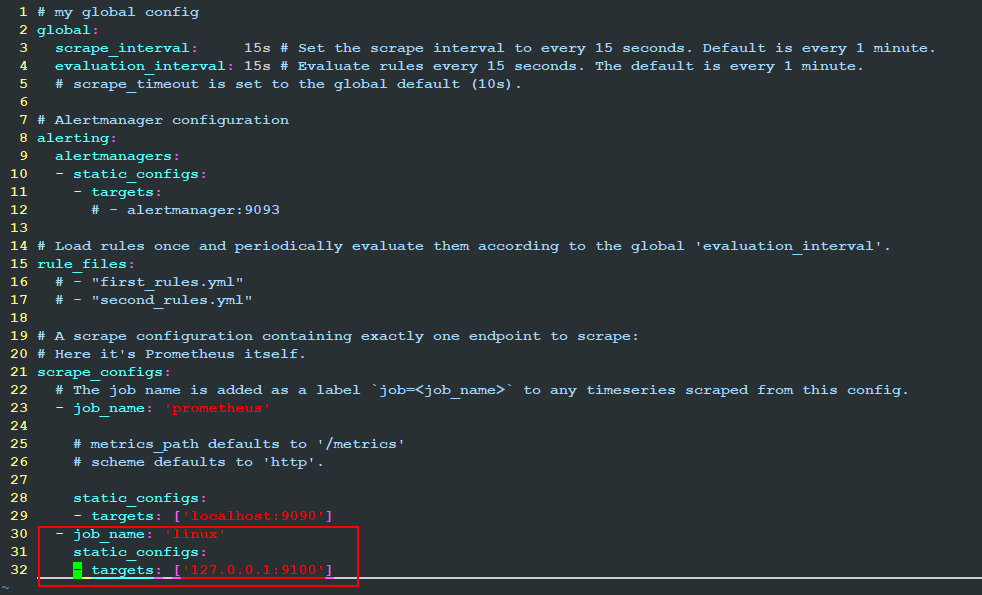
在Prometheus server的配置文件prometheus.yml中增加监控节点
启动node_exporter
nohup /home/jiyanlong/node_exporter-1.1.2.linux-amd64/node_exporter >node_exporter.log 2>&1 &
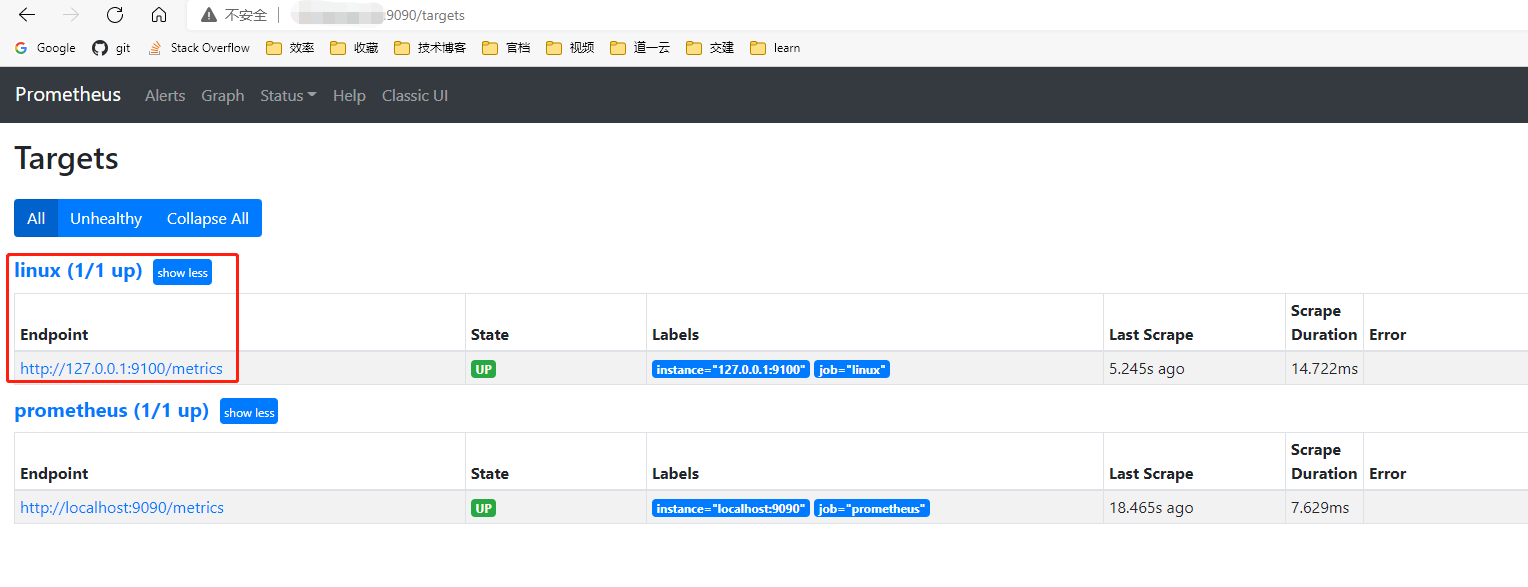
启动成功后测试采集信息是否正常
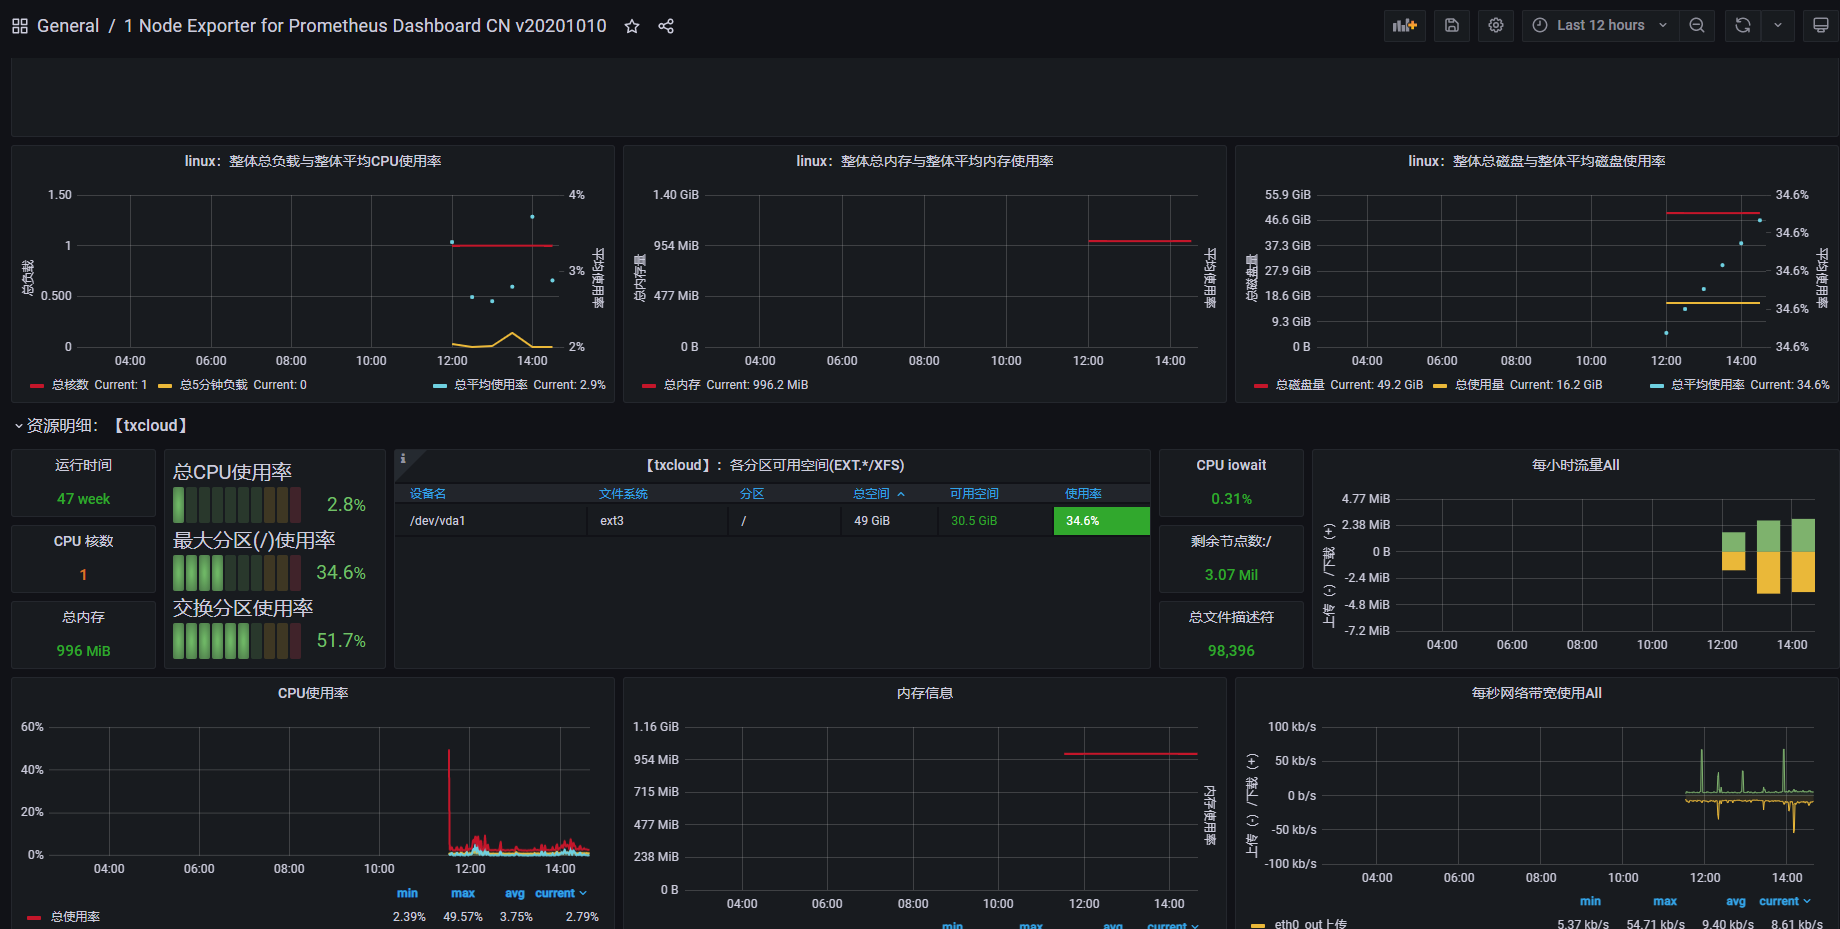
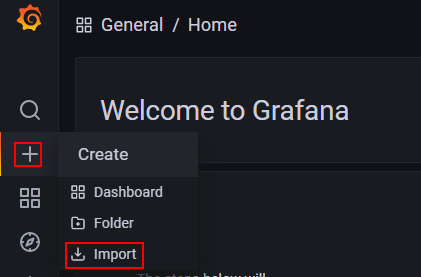
grafana添加node_exporter监控dashboard
https://grafana.com/grafana/dashboards?dataSource=prometheus(dashboard模板下载地址)
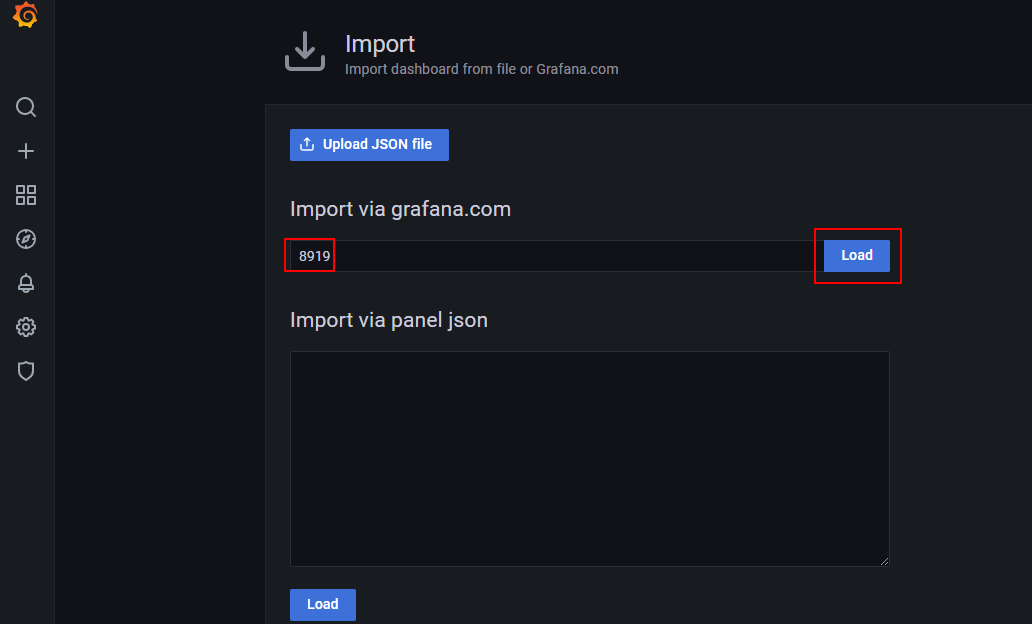
这里node_exporter的模板id是8919
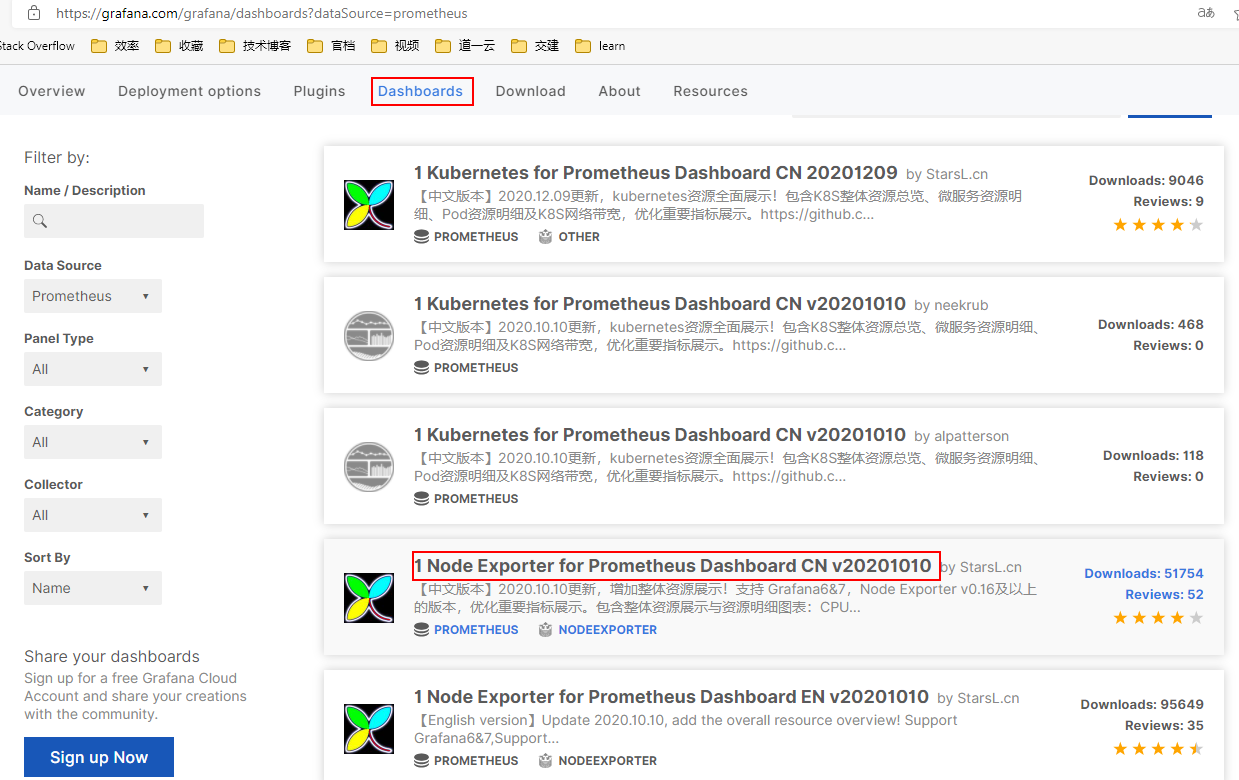
grafana可以通过id或json文件导入模板
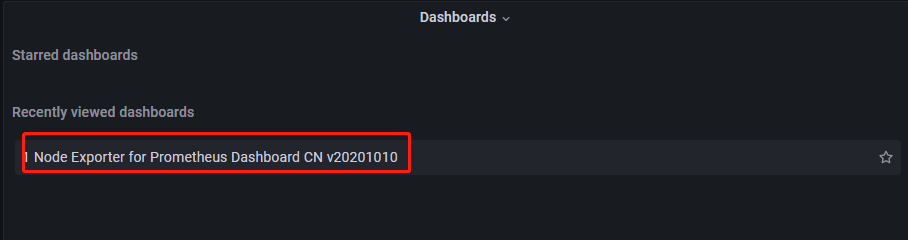
导入模板后图标如下