一直想把这几个插值公式用代码实现一下,今天闲着没事,尝试尝试。
先从最简单的拉格朗日插值开始!关于拉格朗日插值公式的基础知识就不赘述,百度上一搜一大堆。
基本思路是首先从文件读入给出的样本点,根据输入的插值次数和想要预测的点的x选择合适的样本点区间,最后计算基函数得到结果。直接看代码!(注:这里说样本点不是很准确,实在词穷找不到一个更好的描述。。。)
str2double
一个小问题就是怎样将python中的str类型转换成float类型,毕竟我们给出的样本点不一定总是整数,而且也需要做一些容错处理,比如多个+、多个-等等,也应该能识别为正确的数。所以实现了一个str2double方法。
【20200903更新】如果不用考虑多个前置正号或者负号的情况,直接用float()就可以,我居然今天才知道QAQ。
import re
def str2double(str_num):
    pattern = re.compile(r'^((+*)|(-*))?(d+)(.(d+))?$')
    m = pattern.match(str_num)
    if m is None:
        return m
    else:
        sign = 1 if str_num[0] == '+' or '0' <= str_num[0] <= '9' else -1
        num = re.sub(r'(++)|(-+)', "", m.group(0))
        matchObj = re.match(r'^d+$', num)
        if matchObj is not None:
            num = sign * int(matchObj.group(0))
        else:
            matchObj = re.match(r'^(d+).(d+)$', num)
            if matchObj is not None:
                integer = int(matchObj.group(1))
                fraction = int(matchObj.group(2)) * pow(10, -1*(len(matchObj.group(2))))
                num = sign * (integer + fraction)
        return num
我使用了正则表达式来实现,pattern = re.compile(r'^((+*)|(-*))?(d+)(.(d+))?$')可以匹配我上面提到的所有类型的整数和浮点数,之后进行匹配,匹配成功,如果是整数,直接return整数部分,这个用(int)强制转换即可;如果是浮点数,那么用(d+)这个正则表达式再次匹配,分别得到整数部分和小数部分,整数部分的处理和上面类似,小数部分则用乘以pow(10, -小数位数)得到,之后直接相加即可。这里为了支持多个+或者-,使用re.sub方法将符号去掉,所以就需要用sign来记录数字的正负,在最后return时乘上sign即可。
binary_search
def binary_search(point_set, n, x):
    first = 0
    length = len(point_set)
    last = length
    while first < last:
        mid = (first + last) // 2
        if point_set[mid][0] < x:
            first = mid + 1
        elif point_set[mid][0] == x:
            return mid
        else:
            last = mid
    last =  last if last != length else last-1

    head = last - 1
    tail = last
    while n > 0:
        if head != -1:
            n -= 1
            head -= 1
        if tail != length:
            n -= 1
            tail += 1
    return [head+1, tail-1] if n == 0 else [head+1, tail-2]
这里point_set是全部样本点的集合,n是输入的插值次数,x是输入的预测点。返回合适的插值区间,即尽可能地把x包在里面。
因为要根据输入得到合适的插值区间,所以就涉及查找方面的知识。这里使用了二分查找,先对样本点集合point_set进行排序(升序),找到第一个大于需要预测点的样本点,在它的两侧扩展区间,直到满足插值次数要求。这里我的实现有些问题,可能会出现n=-1因为tail多加了一次,就在while循环外又进行了一次判断,n=-1时tail-2,这个实现的确不好,可能还会有bug。。。
最后,剩下的内容比较好理解,直接放上全部代码。
import re
import matplotlib.pyplot as plt
import numpy as np
def str2double(str_num):
pattern = re.compile(r'^((+*)|(-*))?(d+)(.(d+))?$')
m = pattern.match(str_num)
if m is None:
return m
else:
sign = 1 if str_num[0] == '+' or '0' <= str_num[0] <= '9' else -1
num = re.sub(r'(++)|(-+)', "", m.group(0))
matchObj = re.match(r'^d+$', num)
if matchObj is not None:
num = sign * int(matchObj.group(0))
else:
matchObj = re.match(r'^(d+).(d+)$', num)
if matchObj is not None:
integer = int(matchObj.group(1))
fraction = int(matchObj.group(2)) * pow(10, -1*(len(matchObj.group(2))))
num = sign * (integer + fraction)
return num
def preprocess():
f = open("input.txt", "r")
lines = f.readlines()
lines = [line.strip('
') for line in lines]
point_set = list()
for line in lines:
point = list(filter(None, line.split(" ")))
point = [str2double(pos) for pos in point]
point_set.append(point)
return point_set
def lagrangeFit(point_set, x):
res = 0
for i in range(len(point_set)):
L = 1
for j in range(len(point_set)):
if i == j:
continue
else:
L = L * (x - point_set[j][0]) / (point_set[i][0] - point_set[j][0])
L = L * point_set[i][1]
res += L
return res
def showbasis(point_set):
print("Lagrange Basis Function:
")
for i in range(len(point_set)):
top = ""
buttom = ""
for j in range(len(point_set)):
if i == j:
continue
else:
top += "(x-{})".format(point_set[j][0])
buttom += "({}-{})".format(point_set[i][0], point_set[j][0])
print("Basis function{}:".format(i))
print(" {}".format(top))
print(" {}".format(buttom))
def binary_search(point_set, n, x):
first = 0
length = len(point_set)
last = length
while first < last:
mid = (first + last) // 2
if point_set[mid][0] < x:
first = mid + 1
elif point_set[mid][0] == x:
return mid
else:
last = mid
last = last if last != length else last-1
head = last - 1
tail = last
while n > 0:
if head != -1:
n -= 1
head -= 1
if tail != length:
n -= 1
tail += 1
return [head+1, tail-1] if n == 0 else [head+1, tail-2]
if __name__ == '__main__':
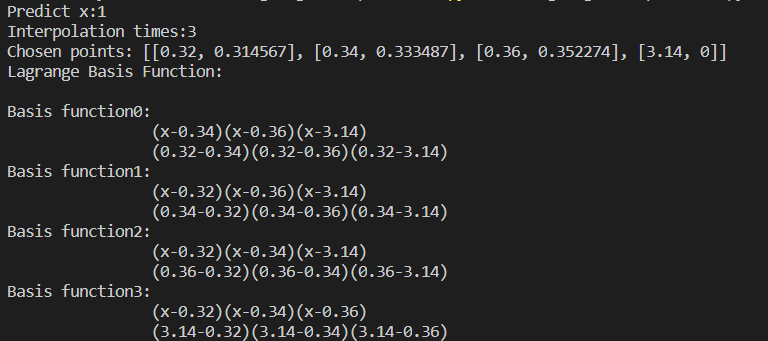
pred_x = input("Predict x:")
pred_x = float(pred_x)
n = input("Interpolation times:")
n = int(n)
point_set = preprocess()
point_set = sorted(point_set, key=lambda a: a[0])
span = binary_search(point_set, n+1, pred_x)
print("Chosen points: {}".format(point_set[span[0]:span[1]+1]))
showbasis(point_set[span[0]:span[1]+1])
X = np.linspace(-np.pi, np.pi, 256, endpoint=True)
S = np.sin(X)
L = [lagrangeFit(point_set, x) for x in X]
L1 = [lagrangeFit(point_set[span[0]:span[1]+1], x) for x in X]
plt.figure(figsize=(8, 4))
plt.plot(X, S, label="$sin(x)$", color="red", linewidth=2)
plt.plot(X, L, label="$LagrangeFit-all$", color="blue", linewidth=2)
plt.plot(X, L1, label="$LagrangeFit-special$", color="green", linewidth=2)
plt.xlabel('x')
plt.ylabel('y')
plt.title("$sin(x)$ and Lagrange Fit")
plt.legend()
plt.show()
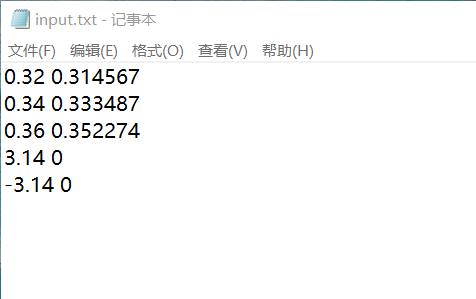
About Input
使用了input.txt进行样本点读入,每一行一个点,中间有一个空格。
结果
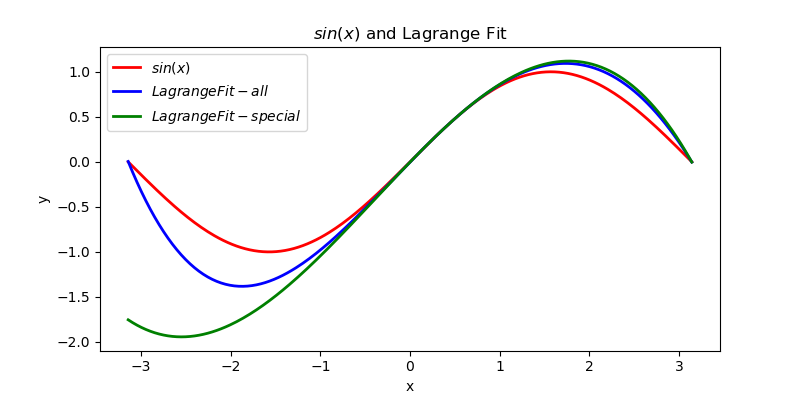
感觉挺好玩的hhh,过几天试试牛顿插值!掰掰!