熔断监控:Hystrix Dashboard
Hystrix Dashboard是一款针对Hystrix进行实时监控的工具,通过Hystrix Dashboard可以直观地看到个Hystrix Command的请求响应时间,请求成功率等数据。但是只使用Hystrix Dashboard的话,只能看到单个应用内的服务信息,所以还需要一个工具能够汇总多个服务的数据并显示到Hystrix Dashboard上,这个工具就是Turbine。
1. 新建maven工程,骨架选择quickstart,命名为demo-hystrix-dashboard
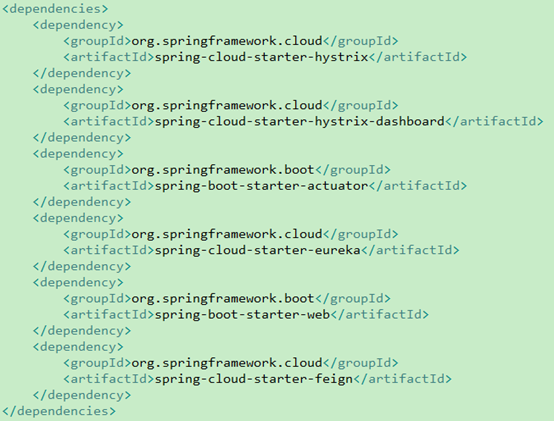
2. 加入相关依赖:
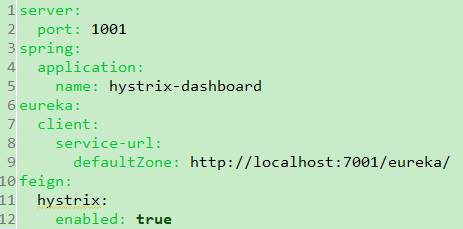
3. 在srcmain esources目录下添加application.yml文件:
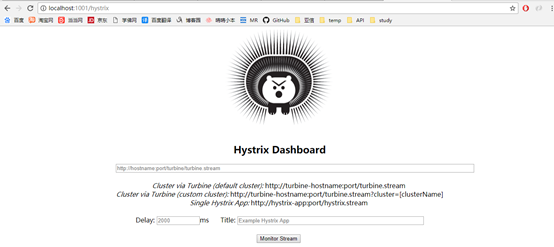
4. 启动该项目,浏览器访问(注:先启动注册中心):
5. 准备工作,启动注册中心,和之前写好的demo-member工程。
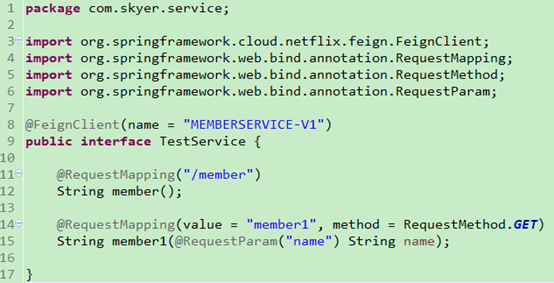
6. 编写TestService类:
7. 编写TestController类:

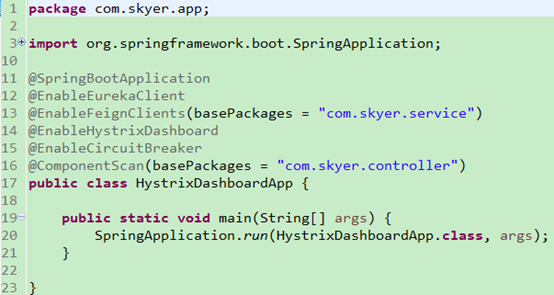
8. 编写启动类:
9. 重新启动该项目,访问http://localhost:1001/hystrix,在搜索框里输入http://localhost:1001/hystrix.stream,点击Monitor Stream按钮,进入监控页面,访问http://localhost:5001/member1?name=123接口,观察监控页面:
