关键词:gdb、strace、kprobe、uprobe、objdump、meminfo、valgrind、backtrace等。

《Debugs Hacks中文版——深入调试的技术和工具》这本书是Miracle Linux一些同事合作,主要关注Linux下的调试技术和工具。
本文章以此书为蓝本进行总结,进行适当的补充。
下面以Debug hacks地图将内容组织如下:
0. 通用技术
《objdump》, 《strace》, 《kprobes》, 《uprobes》, systemtap, oprofile, 《valgrind》, 《/proc/meminfo》, 《/proc/<pid>/maps》
1. 程序异常结束应对方法
1.1 应用问题
内存非法访问SEGV类型问题分析,可以《通过core+gdb离线分析》,通过watch分析非法内存访问,《利用backtrace()/backtrace_symbols()栈回溯》。
1.2 内核问题
1.2.1 内核转储分析
如何设置内核转储?如何分析内核转储文件?
空指针引用,链表破坏等导致的Kernel Panic分析。
死循环,自旋锁,信号量等导致的内核停止响应问题。
实时进程停止响应。
1.2.2 其他分析
《一个内存Oops解读》:不同架构的Oops差异很大,尤其涉及到体系架构相关的寄存器、栈信息等。
2. 程序不结束异常
2.1 应用问题
用top查看负载是否过高?负载不高,则进行《应用程序死锁停止响应分析》;负载高,则进行《应用程序死循环停止响应分析》。
2.2 内核问题
设置内核WDT检测异常
通过SysRq分析问题
1. 使用strace寻找故障线索
strace用于跟踪系统调用, 并显示输入输出情况.
strace -o filename将strace结果保存到filename.
strace -f cmd跟踪fork()之后的进程.
#include <stdio.h>
#include <stdlib.h>

int main(void)
{
  FILE *fp;

  fp = fopen("/etc/shadow", "r");
  if(fp == NULL)
  {
    printf("Error!
");
    return EXIT_FAILURE;
  }
  return EXIT_SUCCESS;
}
编译如上代码, 使用strace ./st1执行结果如下:
execve("./st1", ["./st1"], [/* 81 vars */]) = 0...
open("/etc/shadow", O_RDONLY)           = -1 EACCES (Permission denied)-----------------找出问题的根源,是因为权限问题.
fstat(1, {st_mode=S_IFCHR|0620, st_rdev=makedev(136, 2), ...}) = 0
write(1, "Error!
", 7Error!------------------------------------------------------------控制台输出内容
)                 = 7
exit_group(1)                           = ?
+++ exited with 1 +++
1.1 显示系统调用地址
strace -i显示对应系统调用地址:
[00007f53cb39e777] execve("./st1", ["./st1"], [/* 81 vars */]) = 0...
[00007f5265e9a040] open("/etc/shadow", O_RDONLY) = -1 EACCES (Permission denied)
[00007f5265e99c34] fstat(1, {st_mode=S_IFCHR|0620, st_rdev=makedev(136, 2), ...}) = 0
[00007f5265e9a2c0] write(1, "Error!
", 7Error!
) = 7
[00007f5265e6f748] exit_group(1)        = ?
[????????????????] +++ exited with 1 +++
1.2 显示系统调用相关时间
strace -tt和strace -ttt显示每个系统调用执行的绝对时间, 只是格式不同.
09:10:35.411774 execve("./st1", ["./st1"], [/* 81 vars */]) = 0
...
09:10:35.416745 open("/etc/shadow", O_RDONLY) = -1 EACCES (Permission denied)
09:10:35.416842 fstat(1, {st_mode=S_IFCHR|0620, st_rdev=makedev(136, 2), ...}) = 0
09:10:35.416925 write(1, "Error!
", 7Error!
) = 7
09:10:35.417019 exit_group(1)           = ?
09:10:35.417161 +++ exited with 1 +++


1537060239.606438 execve("./st1", ["./st1"], [/* 81 vars */]) = 0
...
1537060239.609897 open("/etc/shadow", O_RDONLY) = -1 EACCES (Permission denied)
1537060239.609989 fstat(1, {st_mode=S_IFCHR|0620, st_rdev=makedev(136, 2), ...}) = 0
1537060239.610065 write(1, "Error!
", 7Error!
) = 7
1537060239.610160 exit_group(1)         = ?
1537060239.610330 +++ exited with 1 +++
还有一种strace -r计算上一次系统调用开始到本次系统调用开始时间之间的差值:
     0.000000 execve("./st1", ["./st1"], [/* 81 vars */]) = 0
...
     0.000074 open("/etc/shadow", O_RDONLY) = -1 EACCES (Permission denied)
     0.000086 fstat(1, {st_mode=S_IFCHR|0620, st_rdev=makedev(136, 2), ...}) = 0
     0.000076 write(1, "Error!
", 7Error!
)   = 7
     0.000095 exit_group(1)             = ?
     0.000146 +++ exited with 1 +++
strace -T则显示每个系统调用总开始到结束的耗时.
execve("./st1", ["./st1"], [/* 81 vars */]) = 0 <0.000439>...
open("/etc/shadow", O_RDONLY)           = -1 EACCES (Permission denied) <0.000037>
fstat(1, {st_mode=S_IFCHR|0620, st_rdev=makedev(136, 2), ...}) = 0 <0.000029>
write(1, "Error!
", 7Error!
)                 = 7 <0.000039>
exit_group(1)                           = ?
strace -c显示系统调用耗时的统计信息, 包括耗时百分比time, 总耗时seconds, 系统调用平均耗时usecs/call, 总次数calls, 错误次数errors, 系统调用名称syscall.
% time     seconds  usecs/call     calls    errors syscall
------ ----------- ----------- --------- --------- ----------------
 20.35    0.000046           7         7           mmap
 17.70    0.000040          10         4           mprotect
 15.04    0.000034          34         1           munmap
 11.95    0.000027           9         3         1 open
  7.96    0.000018           6         3         3 access
  7.96    0.000018          18         1           execve
  5.75    0.000013          13         1           write
  3.98    0.000009           3         3           fstat
  3.98    0.000009           3         3           brk
  2.21    0.000005           5         1           read
  2.21    0.000005           3         2           close
  0.88    0.000002           2         1           arch_prctl
------ ----------- ----------- --------- --------- ----------------
100.00    0.000226                    30         4 total
strace -c只显示内核中CPU耗时; 如下strace -w -c显示从系统调用开始到结束的耗时, 更加准确.
% time     seconds  usecs/call     calls    errors syscall
------ ----------- ----------- --------- --------- ----------------
 31.18    0.000386         386         1           execve
 15.67    0.000194          28         7           mmap
 10.18    0.000126          32         4           mprotect
  7.19    0.000089          30         3         1 open
  6.38    0.000079          26         3         3 access
  5.90    0.000073          24         3           fstat
  5.82    0.000072          24         3           brk
  4.60    0.000057          57         1           munmap
  4.28    0.000053          53         1           arch_prctl
  3.72    0.000046          23         2           close
  2.99    0.000037          37         1           write
  2.10    0.000026          26         1           read
------ ----------- ----------- --------- --------- ----------------
100.00    0.001238                    30         4 total
下面对sleep(3)分别使用两个命令进行对比, 可以看出区别如下.
sudo strace -w -c -p `pidof st2`
strace: Process 6277 attached
^Cstrace: Process 6277 detached
% time     seconds  usecs/call     calls    errors syscall
------ ----------- ----------- --------- --------- ----------------
 99.16   93.011518     3000372        31           nanosleep
  0.83    0.781669      781669         1           restart_syscall
  0.00    0.003852         120        32        32 open
  0.00    0.003817         119        32           write
------ ----------- ----------- --------- --------- ----------------
100.00   93.800856                    96        32 total

sudo strace -c -p `pidof st2`
strace: Process 6277 attached
^Cstrace: Process 6277 detached
% time     seconds  usecs/call     calls    errors syscall
------ ----------- ----------- --------- --------- ----------------
 41.00    0.007169          54       132       132 open
 29.53    0.005164          39       131           nanosleep
 29.11    0.005091          39       132           write
  0.35    0.000062          62         1           restart_syscall
------ ----------- ----------- --------- --------- ----------------
100.00    0.017486                   396       132 total
可以看出从用户角度strace -w -p更加准确, nanosleep()耗时基本上为3秒; 但是从内核角度来说, nanosleep并没有实际占用3秒, 而是39微秒.
综上所述,如果要分析单个系统调用的性能strace -T比较合适; 如果要分析系统调用统计信息strace -w -c比较合适.
1.3 attach到已有进程
如果进程已经运行, 可以通过strace -p `pidof st2`来附着到st2进行系统调用跟踪.
#include <stdio.h>
#include <stdlib.h>

int main(void)
{
  FILE *fp;

  while(1){
    fp = fopen("/etc/shadow", "r");
    if(fp == NULL)
    {
      printf("Error!
");
    } else
      close(fp);
    sleep(3);
  }
  return EXIT_SUCCESS;
}
运行输出Error之后, 通过strace附着到st2上, 并且打印系统调用耗时.
可以看出Error的原因, 并且可以看出sleep(3)的实际耗时.
strace: Process 6231 attached
restart_syscall(<... resuming interrupted nanosleep ...>) = 0 <0.637061>
open("/etc/shadow", O_RDONLY)           = -1 EACCES (Permission denied) <0.000117>
write(1, "Error!
", 7)                 = 7 <0.000051>
nanosleep({3, 0}, 0x7ffea3ee5560)       = 0 <3.000289>
open("/etc/shadow", O_RDONLY)           = -1 EACCES (Permission denied) <0.000107>
write(1, "Error!
", 7)                 = 7 <0.000060>
1.4 strace -e高级功能
通过设置strace -e expr, 可以对监控的系统调用进行过滤.
2. valgrind使用方法
2.1 检测内存泄露
内存泄露是申请的内存, 没有被释放. 造成可用内存越来越小, 从而引起内存紧张.
#include <stdio.h>
#include <stdlib.h>
#include <malloc.h>

int main()
{
  char *p = malloc(10);
  return EXIT_SUCCESS;
}
通过valgrind --leak-check=yes ./test1, 得到如下结果.
==9218== Memcheck, a memory error detector
==9218== Copyright (C) 2002-2015, and GNU GPL'd, by Julian Seward et al.
==9218== Using Valgrind-3.11.0 and LibVEX; rerun with -h for copyright info
==9218== Command: ./test1
==9218==
==9218==
==9218== HEAP SUMMARY:--------------------------------------------------------------------------堆的使用情况.
==9218==     in use at exit: 10 bytes in 1 blocks
==9218==   total heap usage: 1 allocs, 0 frees, 10 bytes allocated------------------------------1次分配, 0次释放, 就是问题的根源.
==9218==
==9218== 10 bytes in 1 blocks are definitely lost in loss record 1 of 1
==9218==    at 0x4C2DB8F: malloc (in /usr/lib/valgrind/vgpreload_memcheck-amd64-linux.so)
==9218==    by 0x400537: main (test1.c:7)-------------------------------------------------------具体申请的点,也即泄漏点.
==9218==
==9218== LEAK SUMMARY:--------------------------------------------------------------------------泄露类型, 以及每种泄露情况.
==9218==    definitely lost: 10 bytes in 1 blocks
==9218==    indirectly lost: 0 bytes in 0 blocks
==9218==      possibly lost: 0 bytes in 0 blocks
==9218==    still reachable: 0 bytes in 0 blocks
==9218==         suppressed: 0 bytes in 0 blocks
==9218==
==9218== For counts of detected and suppressed errors, rerun with: -v
==9218== ERROR SUMMARY: 1 errors from 1 contexts (suppressed: 0 from 0)
2.2 检测对非法内存地址的访问
地址的越界操作, 也即堆非法地址访问造成的问题比较隐蔽. 内存踩踏造成的影响, 也比较发散.
#include <stdio.h>
#include <stdlib.h>
#include <malloc.h>

int main()
{
  char *p = malloc(10);
  p[10] = 1;
  free(p);
  return EXIT_SUCCESS;
}
执行valgrind ./test2结果如下:
==9265== Memcheck, a memory error detector
==9265== Copyright (C) 2002-2015, and GNU GPL'd, by Julian Seward et al.
==9265== Using Valgrind-3.11.0 and LibVEX; rerun with -h for copyright info
==9265== Command: ./test2
==9265==
==9265== Invalid write of size 1--------------------------------------------------------------错误类型是, 无效的一字节写.
==9265==    at 0x400584: main (test2.c:8)-----------------------------------------------------错误发生地点.
==9265==  Address 0x520404a is 0 bytes after a block of size 10 alloc'd-----------------------发生错误的地址.
==9265==    at 0x4C2DB8F: malloc (in /usr/lib/valgrind/vgpreload_memcheck-amd64-linux.so)
==9265==    by 0x400577: main (test2.c:7)
==9265==
==9265==
==9265== HEAP SUMMARY:------------------------------------------------------------------------可以看出堆的使用没有问题, 申请的内存被正确的释放了.
==9265==     in use at exit: 0 bytes in 0 blocks
==9265==   total heap usage: 1 allocs, 1 frees, 10 bytes allocated
==9265==
==9265== All heap blocks were freed -- no leaks are possible
==9265==
==9265== For counts of detected and suppressed errors, rerun with: -v
==9265== ERROR SUMMARY: 1 errors from 1 contexts (suppressed: 0 from 0)
2.3 访问已释放的区域
访问已释放的内存同样也可能造成一些未知的错误, 造成一些不可理解的错误.
#include <stdio.h>
#include <stdlib.h>
#include <malloc.h>

int main()
{
  char *x = malloc(sizeof(int));

  free(x);
  int a = *x + 1;

  return EXIT_SUCCESS;
}
执行valgrind ./test4结果如下:
==9341== Memcheck, a memory error detector
==9341== Copyright (C) 2002-2015, and GNU GPL'd, by Julian Seward et al.
==9341== Using Valgrind-3.11.0 and LibVEX; rerun with -h for copyright info
==9341== Command: ./test4
==9341==
==9341== Invalid read of size 1-------------------------------------------------------------读一字节错误.
==9341==    at 0x40058C: main (test4.c:10)--------------------------------------------------错误发生位置.
==9341==  Address 0x5204040 is 0 bytes inside a block of size 4 free'd----------------------表明操作的地址只想一个已经被释放的内存区域, 下面是详细的申请位置和释放位置.
==9341==    at 0x4C2EDEB: free (in /usr/lib/valgrind/vgpreload_memcheck-amd64-linux.so)
==9341==    by 0x400587: main (test4.c:9)
==9341==  Block was alloc'd at
==9341==    at 0x4C2DB8F: malloc (in /usr/lib/valgrind/vgpreload_memcheck-amd64-linux.so)
==9341==    by 0x400577: main (test4.c:7)
==9341==
==9341==
==9341== HEAP SUMMARY:
==9341==     in use at exit: 0 bytes in 0 blocks
==9341==   total heap usage: 1 allocs, 1 frees, 4 bytes allocated
==9341==
==9341== All heap blocks were freed -- no leaks are possible
==9341==
==9341== For counts of detected and suppressed errors, rerun with: -v
==9341== ERROR SUMMARY: 1 errors from 1 contexts (suppressed: 0 from 0)
2.4 内存双重释放
内存的双重释放问题在程序执行时, 已经可以暴露. 或者通过gdb + ulimit -c unlimited去分析.
#include <stdio.h>
#include <stdlib.h>
#include <malloc.h>

int main()
{
  char *x = malloc(sizeof(int));

  free(x);
  free(x);

  return EXIT_SUCCESS;
}
但是valgrind ./test5也提供了详细的信息,
==9636== Memcheck, a memory error detector
==9636== Copyright (C) 2002-2015, and GNU GPL'd, by Julian Seward et al.
==9636== Using Valgrind-3.11.0 and LibVEX; rerun with -h for copyright info
==9636== Command: ./test5
==9636==
==9636== Invalid free() / delete / delete[] / realloc()------------------------------------非正常释放
==9636==    at 0x4C2EDEB: free (in /usr/lib/valgrind/vgpreload_memcheck-amd64-linux.so)----产生错误的位置, 下面是正常的申请和释放位置.
==9636==    by 0x400593: main (test5.c:10)
==9636==  Address 0x5204040 is 0 bytes inside a block of size 4 free'd
==9636==    at 0x4C2EDEB: free (in /usr/lib/valgrind/vgpreload_memcheck-amd64-linux.so)
==9636==    by 0x400587: main (test5.c:9)
==9636==  Block was alloc'd at
==9636==    at 0x4C2DB8F: malloc (in /usr/lib/valgrind/vgpreload_memcheck-amd64-linux.so)
==9636==    by 0x400577: main (test5.c:7)
==9636==
==9636==
==9636== HEAP SUMMARY:---------------------------------------------------------------------堆的使用情况, 一个申请两个释放.
==9636==     in use at exit: 0 bytes in 0 blocks
==9636==   total heap usage: 1 allocs, 2 frees, 4 bytes allocated
==9636==
==9636== All heap blocks were freed -- no leaks are possible
==9636==
==9636== For counts of detected and suppressed errors, rerun with: -v
==9636== ERROR SUMMARY: 1 errors from 1 contexts (suppressed: 0 from 0)
2.5 非法栈操作
#include <stdio.h>
#include <stdlib.h>
#include <malloc.h>

int main()
{
  int a;

  int *p = &a;
  p -= 0x80;
  *p = 1;

  return EXIT_SUCCESS;
}
将p指向的地址向前移动512字节, 这个地址已经在栈之外了. 结果如下:
==10026== Memcheck, a memory error detector
==10026== Copyright (C) 2002-2015, and GNU GPL'd, by Julian Seward et al.
==10026== Using Valgrind-3.11.0 and LibVEX; rerun with -h for copyright info
==10026== Command: ./test6
==10026==
==10026== Invalid write of size 4-------------------------------------------------非法的写, 超出栈的区域.
==10026==    at 0x400571: main (in /home/al/debug_hacks/valgrind/test6)-----------产生非法写的位置.
==10026==  Address 0xffefff8ac is on thread 1's stack
==10026==  500 bytes below stack pointer------------------------------------------相对于栈指针的偏移.
==10026==
==10026==
==10026== HEAP SUMMARY:
==10026==     in use at exit: 0 bytes in 0 blocks
==10026==   total heap usage: 0 allocs, 0 frees, 0 bytes allocated
==10026==
==10026== All heap blocks were freed -- no leaks are possible
==10026==
==10026== For counts of detected and suppressed errors, rerun with: -v
==10026== ERROR SUMMARY: 1 errors from 1 contexts (suppressed: 0 from 0)
2.6 不对称释放
不对称释放, 也即free释放的内存并不是malloc()分配的.
#include <stdio.h>
#include <stdlib.h>
#include <memory.h>

int main()
{
  char szTest[100] = {0};
  char *p = szTest;
  free(p);

  return 0;
}
==11548== Memcheck, a memory error detector
==11548== Copyright (C) 2002-2015, and GNU GPL'd, by Julian Seward et al.
==11548== Using Valgrind-3.11.0 and LibVEX; rerun with -h for copyright info
==11548== Command: ./test7
==11548==
==11548== Invalid free() / delete / delete[] / realloc()---------------------------------------不正确的释放free().
==11548==    at 0x4C2EDEB: free (in /usr/lib/valgrind/vgpreload_memcheck-amd64-linux.so)
==11548==    by 0x4005DD: main (test7.c:10)----------------------------------------------------异常出现地点.
==11548==  Address 0xffefffa50 is on thread 1's stack
==11548==  in frame #1, created by main (test7.c:7)
==11548==
==11548==
==11548== HEAP SUMMARY:
==11548==     in use at exit: 0 bytes in 0 blocks
==11548==   total heap usage: 0 allocs, 1 frees, 0 bytes allocated------------------------------没有malloc()的free().
==11548==
==11548== All heap blocks were freed -- no leaks are possible
==11548==
==11548== For counts of detected and suppressed errors, rerun with: -v
==11548== ERROR SUMMARY: 1 errors from 1 contexts (suppressed: 0 from 0)
3. 利用backtrace()/backtrace_symbols()栈回溯
利用backtrace()获取当前线程调用栈,然后通过backtrace_symbols()将地址转化为一个字符串数组。从而实现了用户空间的栈回溯。
在头文件"execinfo.h"中声明了三个函数用于获取当前线程的函数调用堆栈。
#include <execinfo.h>
int backtrace(void **buffer, int size);
char **backtrace_symbols(void *const *buffer, int size);
void backtrace_symbols_fd(void *const *buffer, int size, int fd);
int backtrace(void **buffer, int size)
该函数用于获取当前线程的调用堆栈,获取的信息将会被存放在buffer中,它是一个指针数组;参数 size 用来指定buffer中可以保存多少个void* 元素。
函数返回值是实际获取的指针个数,最大不超过size大小在buffer中的指针实际是从堆栈中获取的返回地址,每一个堆栈frame有一个返回地址。
注意某些编译器的优化选项对获取正确的调用堆栈有干扰,另外内联函数没有堆栈框架;删除框架指针也会使无法正确解析堆栈内容。
char ** backtrace_symbols (void *const *buffer, int size)
backtrace_symbols()将从backtrace函数获取的信息转化为一个字符串数组。
参数buffer应该是从backtrace函数获取的数组指针,size是该数组中的元素个数(backtrace的返回值),函数返回值是一个指向字符串数组的指针,它的大小同buffer相同。
每个字符串包含了一个相对于buffer中对应元素的可打印信息。它包括函数名,函数的偏移地址,和实际的返回地址。
现在,只有使用ELF二进制格式的程序和苦衷才能获取函数名称和偏移地址。在其他系统,只有16进制的返回地址能被获取。另外,你可能需要传递相应的标志给链接器,以能支持函数名功能(比如,在使用GNU ld的系统中,你需要传递(-rdynamic))。
backtrace_symbols()生成的字符串都是malloc出来的,但是不要最后一个一个的free,因为backtrace_symbols是根据backtrace给出的call stack层数,一次性的malloc出来一块内存来存放结果字符串的,所以,像上面代码一样,只需要在最后,free backtrace_symbols()的返回指针就OK了。
这一点backtrace的manual中也是特别提到的。
注意:如果不能为字符串获取足够的空间函数的返回值将会为NULL
void backtrace_symbols_fd (void *const *buffer, int size, int fd)
backtrace_symbols_fd()与backtrace_symbols()函数具有相同的功能,不同的是它不会给调用者返回字符串数组,而是将结果写入文件描述符为fd的文件中,每个函数对应一行.它不需要调用malloc函数,因此适用于有可能调用该函数会失败的情况。
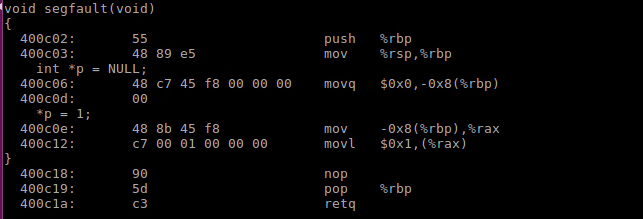
#include <execinfo.h>
#include <stdio.h>
#include <stdlib.h>
#include <unistd.h>
#include <signal.h>

#define SIZE 1000

void trace(int signo)
{
    int j, nptrs;

    void *buffer[SIZE];
    char **strings;

    printf("signo: %d
", signo);

    nptrs = backtrace(buffer, SIZE);
    printf("backtrace() returned %d addresses
", nptrs);

    /* The call backtrace_symbols_fd(buffer, nptrs, STDOUT_FILENO)
     *               would produce similar output to the following: */

    strings = backtrace_symbols(buffer, nptrs);
    if (strings == NULL) {
        perror("Backtrace:");
        exit(EXIT_FAILURE);
    }

    for (j = 0; j < nptrs; j++)
        printf("%s
", strings[j]);

    free(strings);

    if (SIGSEGV == signo || SIGQUIT == signo) {
        exit(0);
    }
}

void segfault(void)
{
    int *p = NULL;
    *p = 1;
}

int main(int argc, char *argv[])
{
    signal(SIGSEGV, trace);
    signal(SIGINT, trace);
    signal(SIGQUIT, trace);

    while (1) {
        sleep(1);
        if (time(0) % 7 == 0) {
            segfault();
        }
    }

    return 0;
}
编译的时候 需要打开-g -rdynamic -fexceptions选项,
gcc -g -rdynamic -fexceptions backtrace.c -o backtrace
然后执行./backtrace得到如下结果:
./backtrace(trace+0x4b) [0x400b21]
/lib/x86_64-linux-gnu/libc.so.6(+0x354b0) [0x7fc4a97b54b0]
./backtrace(segfault+0x10) [0x400c12]
./backtrace(main+0x85) [0x400ca0]
/lib/x86_64-linux-gnu/libc.so.6(__libc_start_main+0xf0) [0x7fc4a97a0830]
./backtrace(_start+0x29) [0x400a09]
除了trace()函数,最接近的是segfault函数。
通过addr2line获取在文件中位置。
addr2line 0x400c12 -e backtrace -afs
0x0000000000400c12
segfault
backtrace.c:43
还可以通过objdump -SC backtrace,查看详细信息。可以看出0x400C12对应的内容是*p = 1;。
4. objdump使用说明
objdump命令是用查看目标文件或者可执行的目标文件的构成的gcc工具。
objdump是gcc工具,用来查看编译后目标文件的组成。
常用命令:
objdump -x obj:以某种分类信息的形式把目标文件的数据组成输出;<可查到该文件的的所有动态库>
objdump -t obj:输出目标文件的符号表()
objdump -h obj:输出目标文件的所有段概括()
objdump -j ./text/.data -S obj:输出指定段的信息(反汇编源代码)
objdump -S obj:输出目标文件的符号表(), 当gcc -g时打印更明显
objdump -j .text -Sl stack1 | more
-S 尽可能反汇编出源代码,尤其当编译的时候指定了-g这种调试参数时,效果比较明显。隐含了-d参数。PS:需要objdump和源码统一目录下。
-l 用文件名和行号标注相应的目标代码,仅仅和-d、-D或者-r一起使用使用-ld和使用-d的区别不是很大,在源码级调试的时候有用,要求编译时使用了-g之类的调试编译选项。
-j name 仅仅显示指定section的信息。
5. 应用程序死锁停止响应分析
如果锁使用的不好,会造成应用程序停止相应。
gcc -g astall.c -o astall -lpthread编译如下代码:
#include <stdio.h>
#include <stdlib.h>
#include <pthread.h>

pthread_mutex_t mutex = PTHREAD_MUTEX_INITIALIZER;
int cnt = 0;

void cnt_reset(void)
{
  pthread_mutex_lock(&mutex);
  cnt = 0;
  pthread_mutex_unlock(&mutex);
}


void *thr(void)
{
  while(1) {
    pthread_mutex_lock(&mutex);
    if(cnt > 2)
      cnt_reset();
    else
      cnt++;
    pthread_mutex_unlock(&mutex);

    printf("%d
", cnt);
    sleep(1);
  }
}

int main(void)
{
  pthread_t tid;

  pthread_create(&tid, NULL, thr, NULL);
  pthread_join(tid, NULL);

  return EXIT_SUCCESS;
}
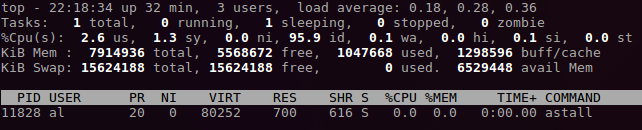
执行程序3秒后,程序就会停止响应。
此时通过top -p `pidof astall`可以看出,进程并没有死循环,而是在睡眠状态。
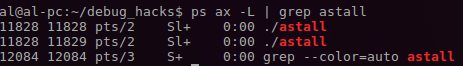
通过ps ax -L | grep astall可以看出两个线程都处于Sl+状态,也即都在睡眠中。
此时可以通过sudo gdb -p `pidof astall` attach到此进程。
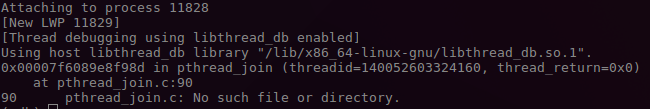
可以看到当前有两个线程在执行.
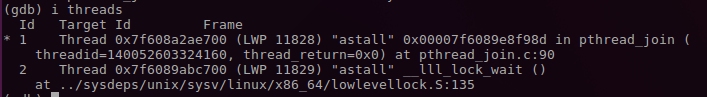
分别查看两个线程的栈信息,线程1的睡眠点符合预期在pthread_join();线程2的睡眠点在pthread_mutex_lock(),这就是问题的根源。
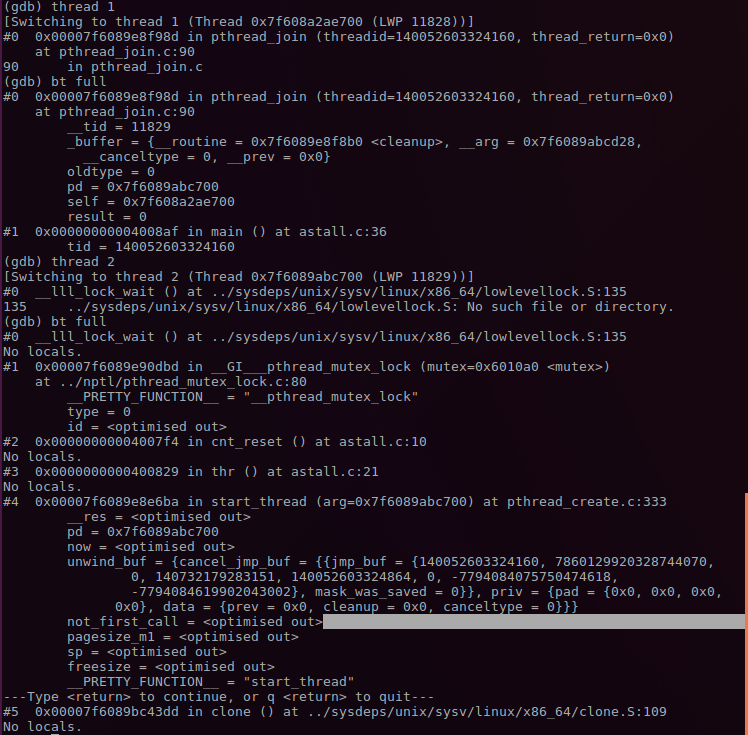
从thread 2的栈回溯start_thread()->thr()->cnt_reset()->pthread_mutex_lock()可以看出,锁死现场。
还可以编写gdb 脚本来记录pthread_mutex_lock()/pthread_mutex_unlock()被调用是栈信息:
gdb astall -x debug.cmd
set pagination off
set logging file debug.log
set logging overwrite
set logging on

start
set $addr1 = pthread_mutex_lock
set $addr2 = pthread_mutex_unlock
b *$addr1
b *$addr2

while 1
    c
    if $pc != $addr1 && $pc != $addr2
        quit
    end
    bt full
end
6. 应用程序死循环停止响应分析
有时候应用进入死循环,这时候可以通过top简单确认。
如果CPU占用率很高,则说明很可能进入死循环。
#include <stdio.h>
#include <stdlib.h>
#include <pthread.h>

pthread_mutex_t mutex = PTHREAD_MUTEX_INITIALIZER;
int cnt = 0;

void cnt_reset(void)
{
  while(1){};
}


void *thr(void)
{
  while(1) {
    if(cnt > 2)
      cnt_reset();
    else
      cnt++;

    printf("%d
", cnt);
    sleep(1);
  }
}

int main(void)
{
  pthread_t tid;

  pthread_create(&tid, NULL, thr, NULL);
  pthread_join(tid, NULL);

  return EXIT_SUCCESS;
}
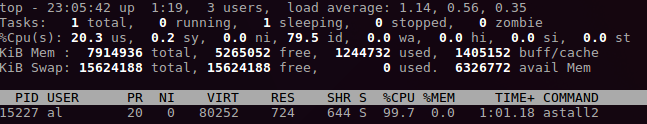
用top可以看出astall2占用率接近100%。
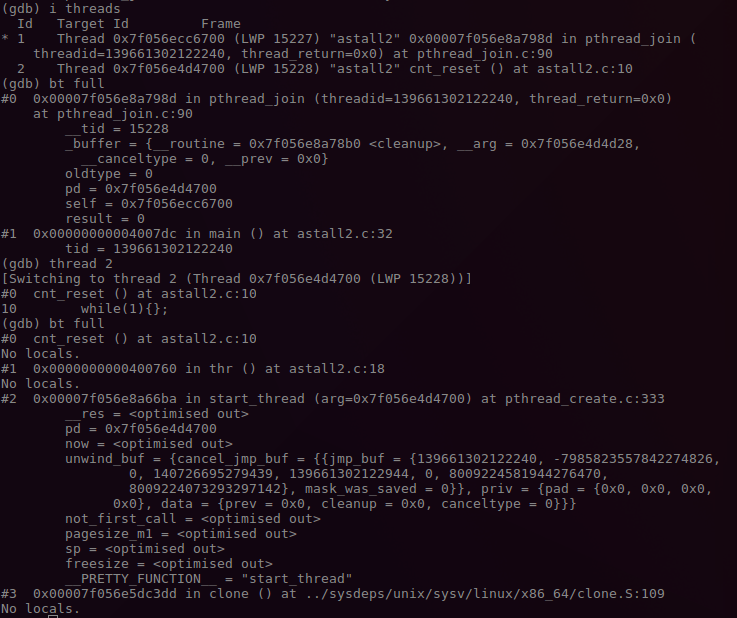
再用ps查看,可以两个进程,一个进程死循环,另一个进程在睡眠。

分别查看两个线程的栈信息,可以明显的看出thread 1处于睡眠状态;thread 2处于while(1),也即问题根源。
6. uprobe使用
uprobe是和kprobe类似的调试方法,编译内核时通过CONFIG_UPROBE_EVENT=y来使能该特性。
6.1 uprobe介绍
和kprobe类似,使用时不需要通过current_tracer来激活,而是检测点通过/sys/kernel/debug/tracing/uprobe_events设置,通过/sys/kernel/debug/tracing/events/uprobes/<EVENT>/enabled来使能。
然而,和kprobe不同的是,使用时需要用户自己计算探测点在用户态文件中的偏移,可以通过nm等工具,这还是有点麻烦的。
可以通过/sys/kernel/debug/tracing/uprobe_profile来查看某一检测事件命中的总数和没有命中的总数。第一列是事件名称,第二列是事件命中的次数,第三列是事件miss-hits的次数。
6.2 uprobe示例
#include <stdlib.h>
#include <stdio.h>

int count = 0;

int do_sth()
{
    printf("current count = %d
", count);
    return count++;
}

int main(int argc, char* argv[])
{
    int i = 0;
    while(1)
    {
        i = do_sth();
    };

    return 0;
}
获取函数的偏移方法:1.通过objdump找到函数对应地址A1;2.在maps查看程序对应的加载地址A2。A1-A2就是探测点函数的偏移地址。
# cat /proc/`pgrep  bash`/maps | grep /bin/bash | grep r-xp
   00400000-004e1000 r-xp 00000000 08:01 786439                             /bin/bash
# objdump -T /bin/zsh | grep -w free
   00000000004ab500 g    DF .text    0000000000000009  Base        free
使用如下:
echo > /sys/kernel/debug/tracing/trace

echo 'p:myprobe do_sys_open dfd=%ax filename=%dx flags=%cx mode=+4($stack)' > /sys/kernel/debug/tracing/kprobe_events
echo 'r:myretprobe do_sys_open ret=$retval' >> /sys/kernel/debug/tracing/kprobe_events
echo 'p:do_sth /home/al/debug_hacks/uprobe/loop_print:0x526 %ip %ax' > /sys/kernel/debug/tracing/uprobe_events
echo 'r:do_sth_exit /home/al/debug_hacks/uprobe/loop_print:0x526 %ip %ax' >> /sys/kernel/debug/tracing/uprobe_events

echo 1 > /sys/kernel/debug/tracing/events/kprobes/myprobe/enable
echo 1 > /sys/kernel/debug/tracing/events/kprobes/myretprobe/enable
echo 1 > /sys/kernel/debug/tracing/events/uprobes/do_sth/enable
echo 1 > /sys/kernel/debug/tracing/events/uprobes/do_sth_exit/enable

echo 0 > /sys/kernel/debug/tracing/events/kprobes/myprobe/enable
echo 0 > /sys/kernel/debug/tracing/events/kprobes/myretprobe/enable
echo 0 > /sys/kernel/debug/tracing/events/uprobes/do_sth/enable
echo 0 > /sys/kernel/debug/tracing/events/uprobes/do_sth_exit/enable

echo > /sys/kernel/debug/tracing/kprobe_events
echo > /sys/kernel/debug/tracing/uprobe_events

cat /sys/kernel/debug/tracing/trace
7. systemtap
8. oprofile
配置编译环境和下载源码:
sudo apt install binutils-dev libiberty-dev libpopt-dev -y
wget https://nchc.dl.sourceforge.net/project/oprofile/oprofile/oprofile-1.3.0/oprofile-1.3.0.tar.gz