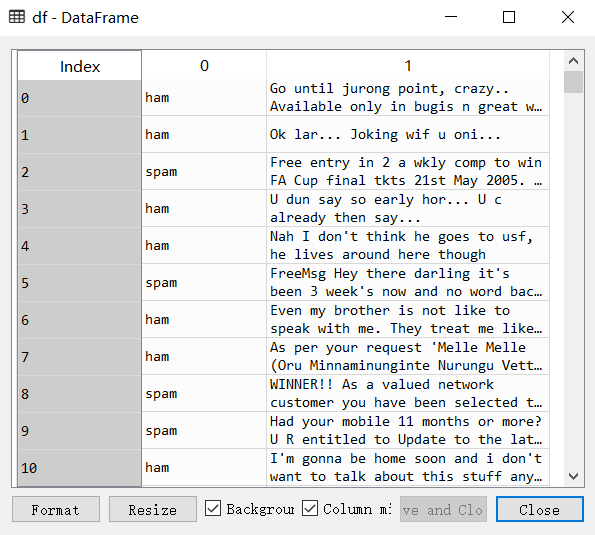
数据来自UCI机器学习仓库中的垃圾信息数据集
数据可从http://archive.ics.uci.edu/ml/datasets/sms+spam+collection下载
转成csv载入数据
import matplotlib
matplotlib.rcParams['font.sans-serif']=[u'simHei']
matplotlib.rcParams['axes.unicode_minus']=False
import pandas as pd
import numpy as np
from sklearn.feature_extraction.text import TfidfVectorizer
from sklearn.linear_model.logistic import LogisticRegression
from sklearn.model_selection import train_test_split,cross_val_score

df = pd.read_csv('data/SMSSpamCollection.csv',header=None)
print(df.head)

print("垃圾邮件个数:%s" % df[df[0]=='spam'][0].count())
print("正常邮件个数:%s" % df[df[0]=='ham'][0].count())

垃圾邮件个数:747
正常邮件个数:4825
创建TfidfVectorizer实例,将训练文本和测试文本都进行转换
X = df[1].values
y = df[0].values
X_train_raw,X_test_raw,y_train,y_test=train_test_split(X,y)
vectorizer = TfidfVectorizer()
X_train = vectorizer.fit_transform(X_train_raw)
X_test = vectorizer.transform(X_test_raw)
建立逻辑回归模型训练和预测
LR = LogisticRegression()
LR.fit(X_train,y_train)
predictions = LR.predict(X_test)
for i,prediction in enumerate(predictions[:5]):
    print("预测为 %s ,信件为 %s" % (prediction,X_test_raw[i]))
预测为 ham ,信件为 Send to someone else :-)
预测为 ham ,信件为 Easy ah?sen got selected means its good..
预测为 ham ,信件为 Sorry da. I gone mad so many pending works what to do.
预测为 ham ,信件为 What not under standing.
预测为 spam ,信件为 SIX chances to win CASH! From 100 to 20,000 pounds txt> CSH11 and send to 87575. Cost 150p/day, 6days, 16+ TsandCs apply Reply HL 4 info
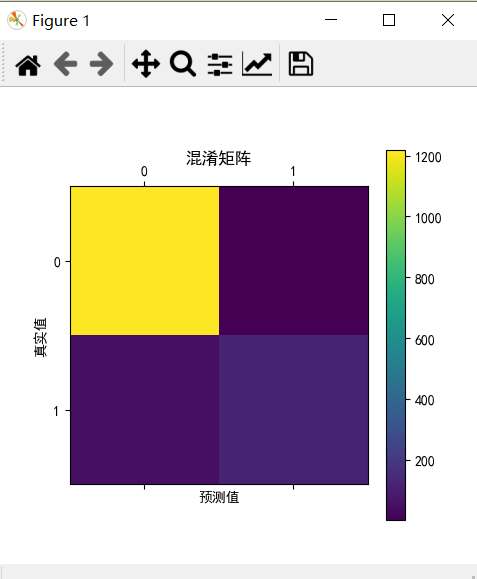
二元分类性能指标:混淆矩阵
# In[2]二元分类分类指标
from sklearn.metrics import confusion_matrix
import matplotlib.pyplot as plt
# predictions 与 y_test
confusion_matrix = confusion_matrix(y_test,predictions)
print(confusion_matrix)
plt.matshow(confusion_matrix)
plt.title("混淆矩阵")
plt.colorbar()
plt.ylabel("真实值")
plt.xlabel("预测值")
plt.show()

[[1217    1]
 [  52  123]]
准确率,召回率,精准率,F1值
# In[3] 给出 precision    recall  f1-score   support
from sklearn.metrics import classification_report
print(classification_report(y_test,predictions))

from sklearn.metrics import roc_curve,auc
# 准确率
scores =  cross_val_score(LR,X_train,y_train,cv=5)
print("准确率为: ",scores)
print("平均准确率为: ",np.mean(scores))

# 有时必须要将标签转为数值
from sklearn.preprocessing import LabelEncoder
class_le = LabelEncoder()
y_train_n = class_le.fit_transform(y_train)
y_test_n = class_le.fit_transform(y_test)

# 精准率
precision =  cross_val_score(LR,X_train,y_train_n,cv=5,scoring='precision')
print("平均精准率为: ",np.mean(precision))
# 召回率
recall =  cross_val_score(LR,X_train,y_train_n,cv=5,scoring='recall')
print("平均召回率为: ",np.mean(recall))
# F1值
f1 =  cross_val_score(LR,X_train,y_train_n,cv=5,scoring='f1')
print("平均F1值为: ",np.mean(f1))
准确率为:  [0.96654719 0.95459976 0.95449102 0.9508982  0.96047904]
平均准确率为:  0.9574030433756144
平均精准率为:  0.9906631114805584
平均召回率为:  0.6956979405034325
平均F1值为:  0.8162874707978786
画出ROC曲线,AUV为ROC曲线以下部分的面积
# In[4] ROC曲线 y_test_n为数值
predictions_pro = LR.predict_proba(X_test)
false_positive_rate, recall, thresholds = roc_curve(y_test_n,predictions_pro[:,1])
roc_auc = auc(false_positive_rate, recall)
plt.title("受试者操作特征曲线(ROC)")
plt.plot(false_positive_rate, recall, 'b', label='AUC = % 0.2f' % roc_auc)
plt.legend(loc='lower right')
plt.plot([0,1],[0,1],'r--')
plt.xlim([0.0, 1.0])
plt.ylim([0.0, 1.0])
plt.xlabel('假阳性率')
plt.ylabel('召回率')
plt.show()

所有代码:
# -*- coding: utf-8 -*-
import matplotlib
matplotlib.rcParams['font.sans-serif']=[u'simHei']
matplotlib.rcParams['axes.unicode_minus']=False
import pandas as pd
import numpy as np
from sklearn.feature_extraction.text import TfidfVectorizer
from sklearn.linear_model.logistic import LogisticRegression
from sklearn.model_selection import train_test_split,cross_val_score

df = pd.read_csv('data/SMSSpamCollection.csv',header=None)
print(df.head)

print("垃圾邮件个数:%s" % df[df[0]=='spam'][0].count())
print("正常邮件个数:%s" % df[df[0]=='ham'][0].count())

# In[1]
X = df[1].values
y = df[0].values
X_train_raw,X_test_raw,y_train,y_test=train_test_split(X,y)
vectorizer = TfidfVectorizer()
X_train = vectorizer.fit_transform(X_train_raw)
X_test = vectorizer.transform(X_test_raw)

LR = LogisticRegression()
LR.fit(X_train,y_train)
predictions = LR.predict(X_test)
for i,prediction in enumerate(predictions[:5]):
    print("预测为 %s ,信件为 %s" % (prediction,X_test_raw[i]))


# In[2]二元分类分类指标
from sklearn.metrics import confusion_matrix
import matplotlib.pyplot as plt
# predictions 与 y_test
confusion_matrix = confusion_matrix(y_test,predictions)
print(confusion_matrix)
plt.matshow(confusion_matrix)
plt.title("混淆矩阵")
plt.colorbar()
plt.ylabel("真实值")
plt.xlabel("预测值")
plt.show()

# In[3] 给出 precision    recall  f1-score   support
from sklearn.metrics import classification_report
print(classification_report(y_test,predictions))

from sklearn.metrics import roc_curve,auc
# 准确率
scores =  cross_val_score(LR,X_train,y_train,cv=5)
print("准确率为: ",scores)
print("平均准确率为: ",np.mean(scores))

# 必须要将标签转为数值
from sklearn.preprocessing import LabelEncoder
class_le = LabelEncoder()
y_train_n = class_le.fit_transform(y_train)
y_test_n = class_le.fit_transform(y_test)

# 精准率
precision =  cross_val_score(LR,X_train,y_train_n,cv=5,scoring='precision')
print("平均精准率为: ",np.mean(precision))
# 召回率
recall =  cross_val_score(LR,X_train,y_train_n,cv=5,scoring='recall')
print("平均召回率为: ",np.mean(recall))
# F1值
f1 =  cross_val_score(LR,X_train,y_train_n,cv=5,scoring='f1')
print("平均F1值为: ",np.mean(f1))

# In[4] ROC曲线 y_test_n为数值
predictions_pro = LR.predict_proba(X_test)
false_positive_rate, recall, thresholds = roc_curve(y_test_n,predictions_pro[:,1])
roc_auc = auc(false_positive_rate, recall)
plt.title("受试者操作特征曲线(ROC)")
plt.plot(false_positive_rate, recall, 'b', label='AUC = % 0.2f' % roc_auc)
plt.legend(loc='lower right')
plt.plot([0,1],[0,1],'r--')
plt.xlim([0.0, 1.0])
plt.ylim([0.0, 1.0])
plt.xlabel('假阳性率')
plt.ylabel('召回率')
plt.show()