本文参照了echarts罗列了几种常用的柱状图在d3中的画法
基本柱状图
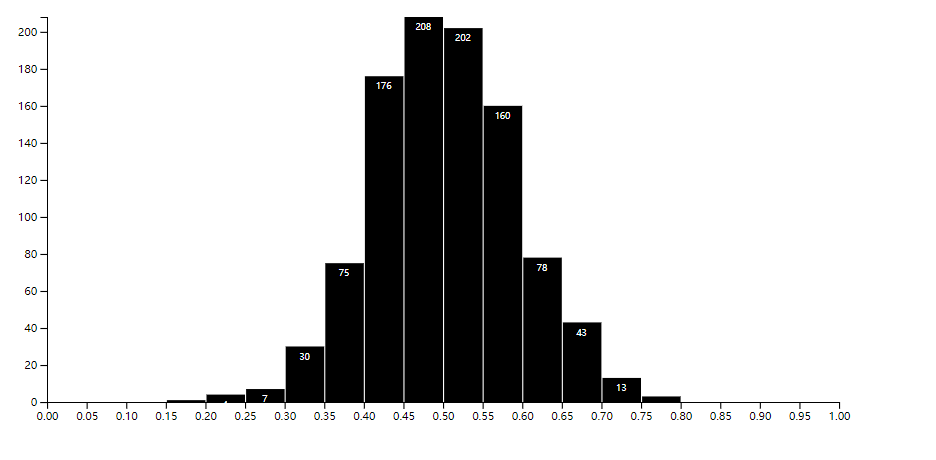
使用d3直方图布局
-
d3的所有布局都不会帮你作图,只是帮你按需处理的数据。
-
使用
d3.randomBates构造一组1000个具有贝茨分布规律并且在1~0的随机数,使用d3.histogram()直方图布局处理数据。统计数据在每个x轴频段出现的频率。然后作出柱状图。 -
处理后的数据
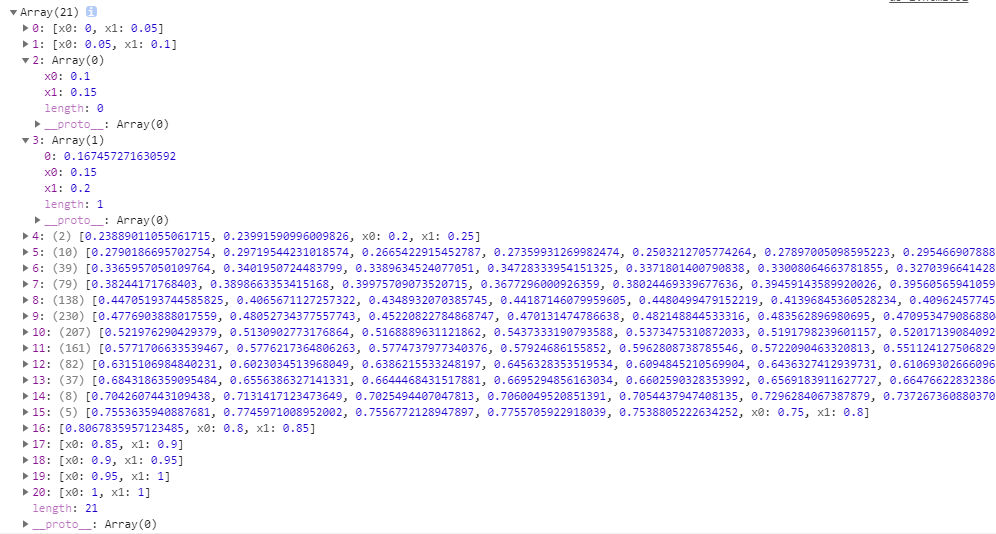
x0、x1:起始及终止的x坐标,length:出现的频数,数组里其他的即为在此频段的数据。
<!DOCTYPE html>
<html>
	<head>
		<meta charset="UTF-8">
		<title>
		</title>
	</head>
	<body>
		<div id="test-svg">
		</div>
	</body>
	<script src="https://d3js.org/d3.v5.js">
	</script>
	<script>
		window.onload = function() {
			//创建具有贝茨分布规律的随机数,0~1
			var datas = d3.range(1000).map(function() {
				return d3.randomBates(10)();
			});

			var width = 800,
			height = 400,
			padding = {
				top: 10,
				right: 40,
				bottom: 40,
				left: 40
			};

			var svg = d3.select("#test-svg")
			.append('svg')
			.attr('width', width + 'px')
			.attr('height', height + 'px');

			// x轴
			var xScale = d3.scaleLinear()
			.range([padding.left, width - padding.right]);
			// 将x轴,0~1,轴分成20个刻度 [0,0.05,0.1,0.15 ...,1.00]

			var xAxis = d3.axisBottom()
			.scale(xScale)
			.ticks(20);
			svg.append('g')
			.call(xAxis)
			.attr("transform", "translate(0," + (height - padding.bottom) + ")");

			// 构造一个直方图布局,返回随机数在每个x轴刻度区域出现的次数
			var his = d3.histogram()
			.domain(xScale.domain())
			.thresholds(xScale.ticks(20))
			(datas);

			// y轴
			var yScale = d3.scaleLinear()
			.domain([0, d3.max(his,
			function(d) {
				return d.length;
			})])
			.range([height - padding.bottom, padding.top]);

			var yAxis = d3.axisLeft()
			.scale(yScale)
			.ticks(10);
			svg.append('g')
			.call(yAxis)
			.attr("transform", "translate(" + padding.left + ",0)");

			var bar = svg.selectAll(".bar")
			.data(his)
			.join("g")
			.attr("class", "bar")
			.attr("transform",
			function(d) {
				return "translate(" + xScale(d.x0) + "," + yScale(d.length) + ")";
			});

			// 构造柱
			bar.append("rect")
			.attr("x", 1)
			.attr("width", xScale(his[0].x1) - xScale(his[0].x0) - 1)
			.attr("height",
			function(d) {
				return height - yScale(d.length) - padding.bottom;
			});

			bar.append("text")
			.attr("dy", ".75em")
			.attr("y", 6)
			.attr("x", (xScale(his[0].x1) - xScale(his[0].x0)) / 2)
			.attr("text-anchor", "middle")
			.attr("font-size", "8px")
			.attr("fill", "White")
			.text(function(d) {
				return d.length;
			});
		}
	</script>
</html>
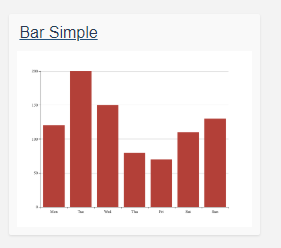
使用原始数据
- 这里使用echarts
Bar Simple的原始数据,和上述类似直接处理数据作图。
<!DOCTYPE html>
<html>

	<head>
		<meta charset="UTF-8">
		<title></title>
	</head>

	<body>
		<div id="test-svg">
		</div>
	</body>
	<script src="https://d3js.org/d3.v5.js"></script>
	<script>
		window.onload = function() {
			// 原始数据
			var datax = ['Mon', 'Tue', 'Wed', 'Thu', 'Fri', 'Sat', 'Sun'];
			var datay = [120, 200, 150, 80, 70, 110, 130];

			var width = 800,
				height = 400,
				padding = {
					top: 10,
					right: 40,
					bottom: 40,
					left: 40
				};

			var svg = d3.select("#test-svg")
				.append('svg')
				.attr('width', width + 'px')
				.attr('height', height + 'px');

			// x轴
			var xScale = d3.scaleOrdinal()
				.domain(datax)
				.range([100, 200, 300, 400, 500, 600, 700]);
			var xAxis = d3.axisBottom()
				.scale(xScale);
			svg.append('g')
				.call(xAxis)
				.attr("transform", "translate(0," + (height - padding.bottom) + ")")
				.selectAll("text")
				.attr("dx", "50px");

			// y轴
			var yScale = d3.scaleLinear()
				.domain([0, d3.max(datay)])
				.range([height - padding.bottom, padding.top]);
			var yAxis = d3.axisLeft()
				.scale(yScale)
				.ticks(10);
			svg.append('g')
				.call(yAxis)
				.attr("transform", "translate(" + 100 + ",0)");

			var bar = svg.selectAll(".bar")
				.data(datay)
				.enter().append("g")
				.attr("class", "bar")
				.attr("transform", function(d, i) {
					return "translate(" + xScale(i * 100) + "," + yScale(d) + ")";
				});

			bar.append("rect")
				.attr("x", 1)
				.attr("width", 100)
				.attr("height", function(d) {
					return height - yScale(d) - padding.bottom;
				})
				.attr("stroke", "White");

			bar.append("text")
				.attr("dy", ".75em")
				.attr("y", 6)
				.attr("x", 50)
				.attr("text-anchor", "middle")
				.attr("font-size", "8px")
				.attr("fill", "White")
				.text(function(d) {
					return d;
				});
		}
	</script>

</html>

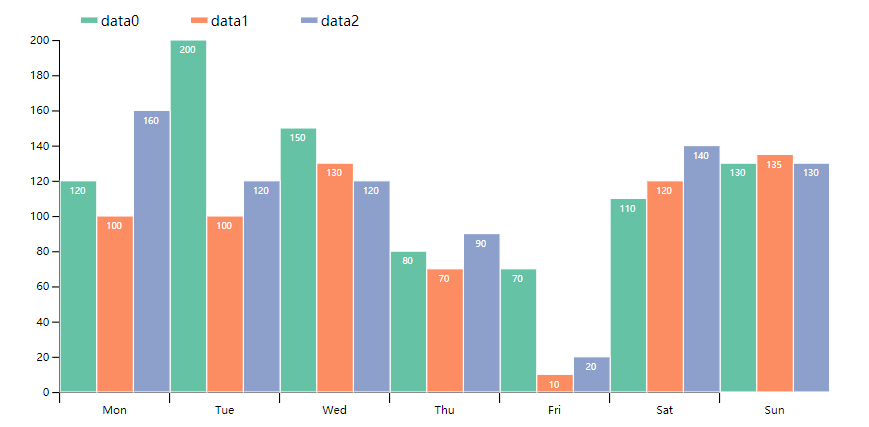
多柱图
在原来的基础上仿照echarts 添加了图例和对应的点击事件。
<!DOCTYPE html>
<html>

	<head>
		<meta charset="UTF-8">
		<title></title>
	</head>

	<body>
		<div id="test-svg">
		</div>
	</body>
	<script src="https://d3js.org/d3.v5.js"></script>
	<script>
		window.onload = function() {

			var datax = ['Mon', 'Tue', 'Wed', 'Thu', 'Fri', 'Sat', 'Sun'];
			var datay = [
				[120, 200, 150, 80, 70, 110, 130],
				[100, 100, 130, 70, 10, 120, 135],
				[160, 120, 120, 90, 20, 140, 130]
			];
			// 用来保存点击时的状态
			var legendStatus = [true, true, true];

			var width = 800,
				height = 400,
				padding = {
					top: 40,
					right: 40,
					bottom: 40,
					left: 40
				};
			var sp = d3.schemeSet2;
			var svg = d3.select("#test-svg")
				.append('svg')
				.attr('width', width + 'px')
				.attr('height', height + 'px');

			// x轴
			var xScale = d3.scaleOrdinal()
				.domain(datax)
				.range([100, 200, 300, 400, 500, 600, 700]);
			var xAxis = d3.axisBottom()
				.scale(xScale)
				.tickSize(10);
			svg.append('g')
				.call(xAxis)
				.attr("transform", "translate(0," + (height - padding.bottom) + ")")
				.selectAll("text")
				.attr("dx", "50px");

			// y轴
			var yScale = d3.scaleLinear()
				.domain([0, d3.max(d3.merge([datay[0], datay[1], datay[2]]))])
				.range([height - padding.bottom, padding.top]);
			var yAxis = d3.axisLeft()
				.scale(yScale)
				.ticks(10);
			svg.append('g')
				.call(yAxis)
				.attr("transform", "translate(" + 100 + ",0)");


            // 这里使用了forEach 考虑到计算柱子偏移量可能会方便一点  也可以直接
            /**
             *
             * var container = svg.selectAll(".container")
             *                  .data(datay)
             *                  .join("g")
			 *				    .attr("class", ".container");
             *
             */

			datay.forEach(function(item, index) {
				var bar = svg.selectAll(".bar" + index)
					.data(item)
					.enter().append("g")
					.attr("class", "bar" + index)
					.attr("transform", function(d, i) {
						var _d = (100 / datay.length) * (index);
						return "translate(" + (xScale(i * 100) + _d) + "," + yScale(d) + ")";
					});

				// 柱
				bar.append("rect")
					.attr("x", 1)
					.attr("width", (100 / datay.length))
					.attr("height", function(d) {
						return height - yScale(d) - padding.bottom;
					})
					.attr("stroke", "White")
					.attr("fill", sp[index]);

				bar.append("text")
					.attr("dy", ".75em")
					.attr("y", 6)
					.attr("x", 100 / (datay.length * 2))
					.attr("text-anchor", "middle")
					.attr("font-size", "8px")
					.attr("fill", "White")
					.text(function(d) {
						return d;
					});

				// 图例
				var legend = svg.append('g');
				var line = legend.append('line')
					.attr('x1', 0)
					.attr('y1', 2)
					.attr('x2', 15)
					.attr('y2', 2)
					.attr('stroke', sp[index])
					.attr('stroke-width', 5);
				var text = legend.append('text')
					.attr('class', 'legend-label')
					.attr("dy", -13)
					.style("text-anchor", "start")
					.text("data" + index)
					.attr('fill', "Black")
					.attr('font-size', '13')
					.attr("transform", "translate(" + 18 + "," + 20 + ")");
				// 图例对应的点击事件
				legend.attr("transform", "translate(" + (padding.left * 3 + index * 100) + "," + padding.top / 2 + ")")
					.on("click", function() {
						var _this = d3.select(this);
						var _i = parseInt(_this.select("text").text().split("data")[1]);

						if(legendStatus[_i]) {
							_this.selectAll("line").attr("stroke", "#d3d3d3");
							_this.selectAll("text").attr("fill", "#d3d3d3");

							svg.selectAll(".bar" + _i)
								.attr("display", "none");
						} else {
							_this.selectAll("line").attr("stroke", sp[_i]);
							_this.selectAll("text").attr("fill", "#Black");

							svg.selectAll(".bar" + _i)
								.attr("display", "show");
						}

						legendStatus[_i] = !legendStatus[_i];
					});
			});
		}
	</script>

</html>

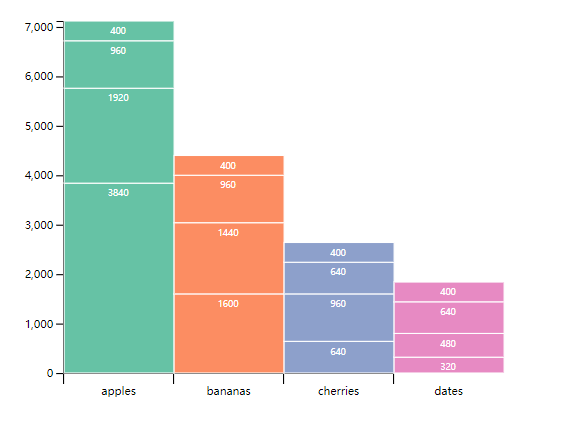
堆叠柱状图
- 使用了
d3.stack()堆叠布局来处理原始数据,然后作图。
<!DOCTYPE html>
<html>

	<head>
		<meta charset="UTF-8">
		<title>
		</title>
	</head>

	<body>
		<div id="test-svg">
		</div>
	</body>
	<script src="https://d3js.org/d3.v5.js">
	</script>
	<script>
		window.onload = function() {
			var data = [{
				apples: 3840,
				bananas: 1920,
				cherries: 960,
				dates: 400
			}, {
				apples: 1600,
				bananas: 1440,
				cherries: 960,
				dates: 400
			}, {
				apples: 640,
				bananas: 960,
				cherries: 640,
				dates: 400
			}, {
				apples: 320,
				bananas: 480,
				cherries: 640,
				dates: 400
			}];

			var width = 800,
				height = 400,
				padding = {
					top: 40,
					right: 40,
					bottom: 40,
					left: 40
				};

			var colors = d3.schemeSet2;
			var svg = d3.select("#test-svg")
				.append('svg')
				.attr('width', width + 'px')
				.attr('height', height + 'px');

			// 使用堆叠布局处理数据
			var stack = d3.stack()
				.keys(["apples", "bananas", "cherries", "dates"])
				.order(d3.stackOrderNone)
				.offset(d3.stackOffsetNone);
			var series = stack(data);

			// x轴
			var xScale = d3.scaleOrdinal()
				.domain(series.map(function(d) {
					return d.key;
				}))
				.range([100, 200, 300, 400]);
			var xAxis = d3.axisBottom()
				.scale(xScale)
				.tickSize(10);
			svg.append('g')
				.call(xAxis)
				.attr("transform", "translate(0," + (height - padding.bottom) + ")")
				.selectAll("text")
				.attr("font-size", "10px")
				.attr("dx", "50px");

			// 求出y轴最大值
			var maxNum = d3.max(series,
				function(d) {
					return d3.max(d,
						function(dd) {
							return dd[1];
						})
				});
			// y轴
			var yScale = d3.scaleLinear()
				.domain([0, maxNum])
				.range([height - padding.bottom, padding.top]);
			var yAxis = d3.axisLeft()
				.scale(yScale)
				.ticks(10);
			svg.append('g')
				.call(yAxis)
				.attr("transform", "translate(" + 100 + ",0)");

			// 画柱
			var bar = svg.selectAll(".bar")
				.data(series)
				.join("g")
				.attr("class", "bar")
				.selectAll("rect")
				.data(function(d) {
					return d;
				});

			bar.join("rect")
				.attr("x", 1)
				.attr("width", 100)
				.attr("height",
					function(d, i) {
						return height - yScale(d[1] - d[0]) - padding.bottom;
					})
				.attr("transform",
					function(d, i) {
						return "translate(" + xScale(i * 100) + "," + yScale(d[1]) + ")";
					})
				.attr("stroke", "White")
				.attr("fill",
					function(d, i) {
						return colors[i];
					});

			bar.join("text")
				.attr("dy", ".75em")
				.attr("y", 6)
				.attr("x", 50)
				.attr("text-anchor", "middle")
				.attr("font-size", "8px")
				.attr("fill", "White")
				.text(function(d) {
					return d[1] - d[0];
				})
				.attr("transform",
					function(d, i) {
						return "translate(" + xScale(i * 100) + "," + yScale(d[1]) + ")";
					});
		}
	</script>

</html>