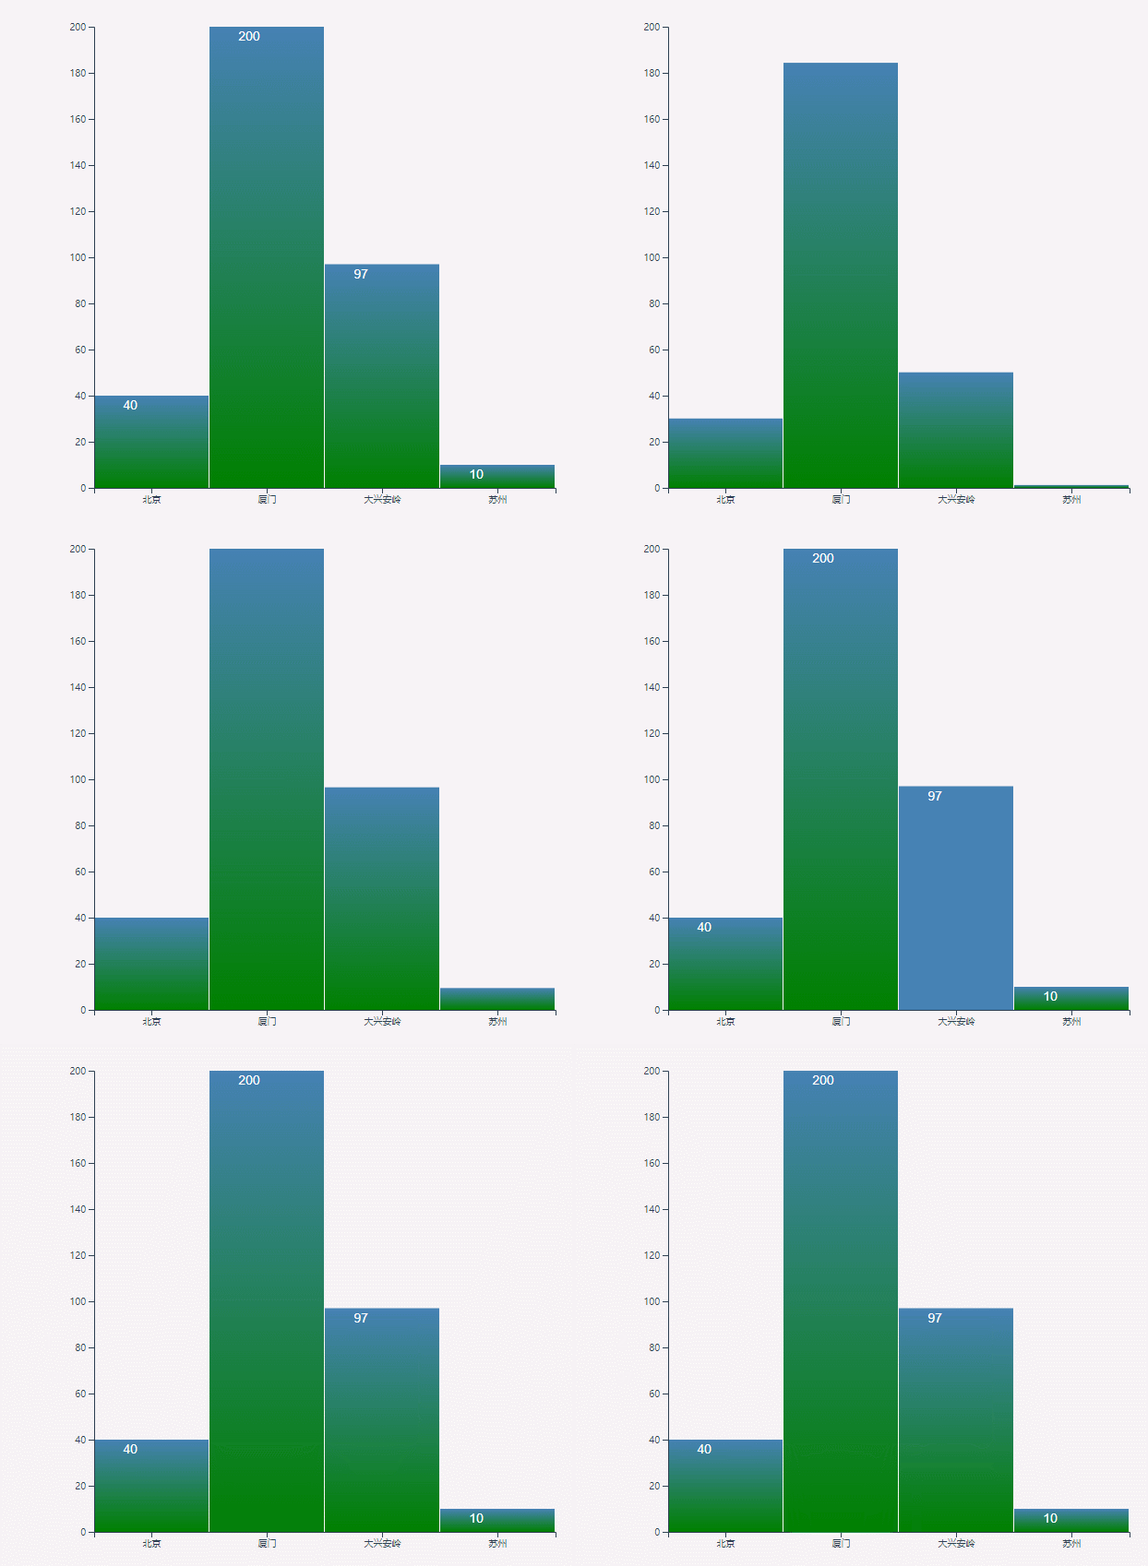
先上效果图:

图中柱状图变成纯蓝色是鼠标滑动过的颜色(颜色可改,本人配色能力十分的强,建议直接用默认设置即可 ( ᖛ ̫ ᖛ )ʃ))
1、环境说明
Vue版本:"vue": "^2.5.2"
d3版本:"d3": "^5.9.1"
2、Histogram.vue源码
  1 <!--
  2   d3组件:柱状图
  3   属性说明:
  4    id:必填,如果同一页面引用多个柱状图,请设置不同的id
  5    width:选填,默认600
  6    height:选填,默认600
  7    begincolor:选填,柱状图渐变色的起始颜色,默认绿色
  8    endcolor:选填,柱状图渐变色的结束颜色,默认蓝色
  9    selectcolor:选填,鼠标滑过柱状图时显示的颜色,默认蓝色
 10    dataset:必填,数据
 11      数据格式:
 12         [
 13           {'name': '北京', value: 40},
 14           {'name': '厦门', value: 200},
 15           {'name': '大兴安岭', value: 97},
 16           {'name': '苏州', value: 10}
 17         ]
 18    rotate:选填,当x轴文字过长,可设置此值为true让文字旋转,默认不旋转
 19    onRectClick: 选填,点击柱状图的自定义事件
 20 -->
 21
 22 <template>
 23   <div class="histogram" :id="id">
 24   </div>
 25 </template>
 26
 27 <script>
 28   import * as d3 from 'd3'
 29   function noop(d, i) {
 30     // console.log(d)
 31     // console.log(i)
 32   }
 33   export default {
 34     name: 'histogram',
 35     props: {
 36       id: String,
 37        Number,
 38       height: Number,
 39       begincolor: String,
 40       endcolor: String,
 41       selectcolor: String,
 42       dataset: Array,
 43       rotate: Boolean,
 44       onRectClick: {
 45         type: Function,
 46         default: noop
 47       }
 48     },
 49     mounted () {
 50       this.init();
 51     },
 52     methods: {
 53       init() {
 54         d3.select("#svg" + this.id).remove();
 55         let width = this.width ? this.width : 600;
 56         let height = this.height ? this.height : 600;
 57         let svg = d3.select("#" + this.id).append("svg").attr("width", width).attr("height", height).attr("id", "svg" + this.id);
 58         let begincolor = this.begincolor ? this.begincolor : 'steelblue';
 59         let endcolor = this.endcolor ? this.endcolor : 'green';
 60         let selectcolor = this.selectcolor ? this.selectcolor : 'steelblue';
 61         let linecolorid = 'linecolor' + this.id;
 62         let linearGradient = svg.append('defs').append('linearGradient').attr('id', linecolorid)
 63           .attr('x1', '0%').attr('y1', '0%').attr('x2', '0%').attr('y2', '100%')
 64         linearGradient.append('stop').attr('offset', '0%').attr('style', 'stop-color:' + begincolor + '; stop-opacity:1')
 65         linearGradient.append('stop').attr('offset', '100%').attr('style', 'stop-color:' + endcolor + '; stop-opacity:1')
 66         let gwidth = width - 100;
 67         let gheight = height - 100;
 68         let values = this.dataset.map(d => d.value)
 69         let xScale1 = d3.scaleBand().range([0, gwidth]).domain(this.dataset.map(d => d.name))
 70         let yScale1 = d3.scaleLinear().domain([0, d3.max(values)]).range([gheight, 0]);
 71         let xAxis = d3.axisBottom().scale(xScale1);
 72         let yAxis = d3.axisLeft().scale(yScale1);
 73         let xScale = d3.scaleBand()
 74           .domain(d3.range(this.dataset.length))
 75           .rangeRound([0, gwidth])
 76           .round(0.05);
 77         let yScale = d3.scaleLinear()
 78           .domain([0, d3.max(values)])
 79           .range([0, gheight]);
 80         svg.selectAll("rect")
 81           .data(values)
 82           .enter()
 83           .append("rect")
 84           .attr("x", (d, i) => 60 + xScale(i))
 85           .attr("width", xScale.bandwidth() - 1)
 86           .attr("y", 50 + gheight)
 87           .attr("height", 0)
 88           .attr("fill", "red")
 89           .on("click", this.onRectClick)
 90           // .on("click", function(d, i) {
 91           //   d3.select(this)
 92           //     .transition()
 93           //     .duration(1000)
 94           //     .ease(d3.easeBounce)
 95           //     .attr("fill", "green");
 96           // })
 97           .on("mouseover", function(d, i) {
 98             d3.select(this)
 99             // .transition(d)
100             // .duration(200)
101             // .ease(d3.easeBounce)
102               .attr("fill", selectcolor);
103           })
104           .on("mouseout", function(d, i) {
105             d3.select(this)
106             // .transition(d)
107             // .duration(200)
108             // .ease(d3.easeBounce)
109               .attr("fill", "url(#" + linecolorid + ")");
110           })
111           .transition()
112           .duration(1500)
113           .ease(d3.easeBounce)
114           .delay((d, i) => i * 200)
115           .attr("y", (d) => 50 + gheight - yScale(d))
116           .attr("height", yScale)
117           .attr("fill", "url(#" + linecolorid + ")");
118
119         svg.selectAll("text")
120           .data(values)
121           .enter()
122           .append("text")
123           .attr("x", (d, i) => 60 + xScale(i))
124           .attr("y", d => 50 + gheight - yScale(d))
125           .attr("dx", xScale.bandwidth() / 4)
126           .attr("dy", 15)
127           .attr("text-anchor", "begin")
128           .attr("font-size", () => {
129             if (width > 400) return 14;
130             else return 10;
131           })
132           .attr("fill", "white")
133           .transition()
134           .delay(2000)
135           .text(d => d);
136
137         let xvalues = svg.append("g")
138           .attr("transform", "translate(60, " + (gheight + 50) + ")")
139           .call(xAxis)
140
141         if (this.rotate) {
142           xvalues.selectAll('text')
143             .attr("dx", -30)
144             .attr("dy", 10)
145             .attr("transform", "rotate(-30)")
146         }
147
148         svg.append("g")
149           .attr("transform", "translate(60, 50)")
150           .call(yAxis);
151
152         // if (this.width && this.height) {
153         //   svg.attr("width", this.width)
154         //     .attr("height", this.height)
155         //     .attr("viewBox", "0 0 600 600");
156         // }
157       }
158     },
159     watch: {
160       dataset() {
161         this.init();
162       }
163     }
164   }
165 </script>
166
167 <style>
168
169 </style>
3、api说明
 1   d3组件:柱状图
 2   属性说明:
 3    id:必填,如果同一页面引用多个柱状图,请设置不同的id
 4    width:选填,默认600
 5    height:选填,默认600
 6    begincolor:选填,柱状图渐变色的起始颜色,默认绿色
 7    endcolor:选填,柱状图渐变色的结束颜色,默认蓝色
 8    selectcolor:选填,鼠标滑过柱状图时显示的颜色,默认蓝色
 9    dataset:必填,数据
10      数据格式:
11         [
12           {'name': '北京', value: 40},
13           {'name': '厦门', value: 200},
14           {'name': '大兴安岭', value: 97},
15           {'name': '苏州', value: 10}
16         ]
17    rotate:选填,当x轴文字过长,可设置此值为true让文字旋转,默认不旋转
18    onRectClick: 选填,点击柱状图的自定义事件
4、使用示例
 1 <template>
 2   <div id="test">
 3     <histogram id="histogram" :dataset="data" :onRectClick="test"></histogram>
 4   </div>
 5 </template>
 6
 7 <script>
 8   import histogram from '@/components/d3/Histogram'
 9   export default {
10     name: 'test',
11     data() {
12       return {
13         data: [
14           {'name': '北京', value: 40},
15           {'name': '厦门', value: 200},
16           {'name': '大兴安岭', value: 97},
17           {'name': '苏州', value: 10}
18         ]
19       }
20     },
21     components: {
22       histogram
23     },
24     methods: {
25       test(d, i) {
26         this.$alert(d, i, {
27           confirmButtonText: '确定',
28           callback: action => {
29             this.$message({
30               type: 'info',
31               message: `action: ${ action }`
32             });
33           }
34         });
35       }
36     }
37   }
38 </script>
39
40 <style scoped>
41 </style>