关于Keras:
Keras是一个高级神经网络API,用Python编写,能够在TensorFlow,CNTK或Theano之上运行。
使用一下命令安装:
pip install keras
在Keras实施深度学习的步骤
- 加载数据。
- 定义模型。
- 编译模型。
- 拟合模型。
- 评估模型。
使用Dense类描述完全连接的层。 我们可以指定层中神经元的数量作为第一个参数,将初始化方法指定为第二个参数作为init,并使用激活参数确定激活函数。 既然定义了模型,我们就可以编译它。 编译模型使用封面下的高效数字库(所谓的后端),如Theano或TensorFlow。 到目前为止,我们已经定义了我们的模型并将其编译为有效计算。 现在是时候在PIMA数据上运行模型了。 我们可以通过调用模型上的fit()函数来训练或拟合我们的数据模型。
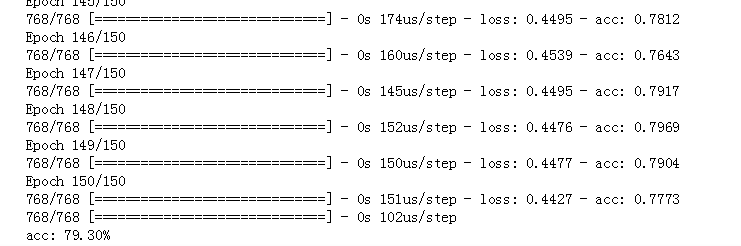
import numpy as np
import pandas as pd
import keras
from keras.models import Sequential
from keras.layers import Dense

# Initializing the seed value to a integer.
seed = 7

np.random.seed(seed)

# Loading the data set (PIMA Diabetes Dataset)
dataset = pd.read_csv(r'C:/Users/Administrator/Desktop/pima-indians-diabetes.csv')
dataset.head()
dataset.shape


# Loading the input values to X and Label values Y using slicing.
X = np.mat(dataset.iloc[:, 0:8])
Y = np.mat(dataset.iloc[:,8]).reshape(-1,1)

# Initializing the Sequential model from KERAS.
model = Sequential()

# Creating a 16 neuron hidden layer with Linear Rectified activation function.
model.add(Dense(16, input_dim=8, init='uniform', activation='relu'))

# Creating a 8 neuron hidden layer.
model.add(Dense(8, init='uniform', activation='relu'))

# Adding a output layer.
model.add(Dense(1, init='uniform', activation='sigmoid'))


# Compiling the model
model.compile(loss='binary_crossentropy',
              optimizer='adam', metrics=['accuracy'])
# Fitting the model
history=model.fit(X, Y, nb_epoch=150, batch_size=10)

scores = model.evaluate(X, Y)

print("%s: %.2f%%" % (model.metrics_names[1], scores[1] * 100))
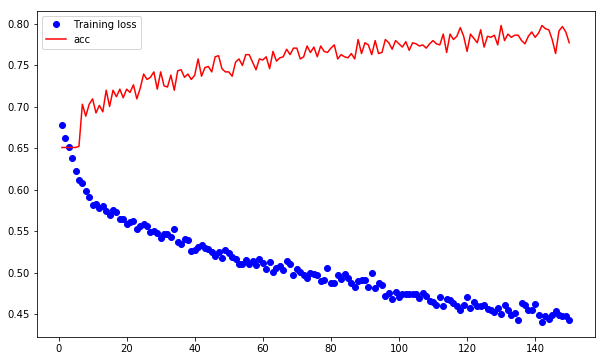
import matplotlib.pyplot as plt

loss =history.history['loss']
val_loss = history.history['acc']
epochs = range(1, len(loss) + 1)
plt.figure(figsize=(10,6))
plt.plot(epochs, loss, 'bo', label='Training loss')
plt.plot(epochs, val_loss, 'r', label='acc')
plt.legend()
plt.show()