var colorGroup = ["#6ca3c4","#76bfa3","#ea8f7a","#499acd","#ba97c9","#98bd76","#e0ab57"];
var iWidth = document.documentElement.clientWidth;
var moreBrokenLineOption = function (options) {
var option = {
backgroundColor: "#fff",
title:{
show:false,
},
legend: {
data: options.legendData,
left: 20*iWidth/720,
icon: 'circle',
bottom: 0*iWidth/720,
textStyle: {
fontSize: 16*iWidth/720,
color: "#91989e",
fontWeight:"normal",
fontFamily:"Microsoft Yahei"
},
},
grid: {
top: 20*iWidth/720,
left: 80*iWidth/720,
right: 40*iWidth/720,
bottom:55*iWidth/720
},
xAxis: [
{
type: 'category',
axisTick: {
show: false
},
axisLine: {
lineStyle: {
color: "#DFE0E1"
}
},
axisLabel: {
margin:12*iWidth/720,
textStyle: {
color: '#6f7479',
fontSize: 16*iWidth/720,
fontWeight:"normal",
fontFamily:"Microsoft Yahei"
}
},
boundaryGap: false,
data: ""
}
],
yAxis: [
{
type: 'value',
nameLocation:"start",
nameTextStyle: {
color: '#ccc',
fontSize: 16*iWidth/720,
fontWeight:"normal",
fontFamily:"Microsoft Yahei"
},
axisTick: {
show: false
},
splitLine: {
show: false
},
axisLine: {
lineStyle: {
color: "#DFE0E1"
}
},
axisLabel: {
textStyle: {
color: '#6f7479',
fontSize: 16*iWidth/720,
fontWeight:"normal",
fontFamily:"Microsoft Yahei"
},
margin:16*iWidth/720,
formatter: function (value, index) {
if (options.axisLabelFormatter) {
return value + '%';
} else {
return value;
}
}
}
}
],
series: []
}
option.xAxis[0].data = (function () {
return options.xAxisData.map(function (item, index) {
return {
value: item,
textStyle: {
fontSize: 17*iWidth/720
}
}
})
})();
(function () {
options.legendData.map(function (item, index) {
option.series.push({
name: item,
type: 'line',
stack: '总量',
data: options.seriesData[index],
symbol: "circle",
symbolSize: '10',
itemStyle: {
normal: {
color: colorGroup[index],
borderType: "solid",
borderWidth: "2",
borderColor: "#fff"
}
},
lineStyle: {
normal: {
color: colorGroup[index]
}
},
areaStyle: {
normal: {
color: colorGroup[index],
opacity:"0.2",
lineStyle: {
color: colorGroup[index]
}
}
}
})
})
})()
return option;
}
使用方法
var bigCharts = function (options) {
var mainDom = document.getElementById(options.parentDom);
var html = '<ul class="header">'
+ '<li class="title">'
+ '<span class="title-title">'+options.title+'</span>'
+ '<sapn class="title-time">'+options.time+'</sapn>'
+ '</li>'
+ '<li class="subtext">'
+ '<span class="subtext-num">'+options.clickNum+'</span>'
+ '<span class="subtext-text">次</span>'
+ '</li>'
+ '</ul>';
mainDom.innerHTML = html;
var echartDom = document.createElement("div");
echartDom.id = options.parentDom + "_echart";
echartDom.className = "big-chart";
mainDom.appendChild(echartDom);
echartDom = null;
var echart = echarts.init(document.getElementById(options.parentDom + "_echart"));
echart.setOption(moreBrokenLineOption({
"legendData": options.legendData,
"xAxisData":options.xAxisData,
"axisLabelFormatter": options.axisLabelFormatter,
"seriesData":options.seriesData
}));
}
bigCharts({
"parentDom":"main0",
"title":"用户访问点击率",
"time":"2016-12-20至2017-02-20",
"clickNum":"100",
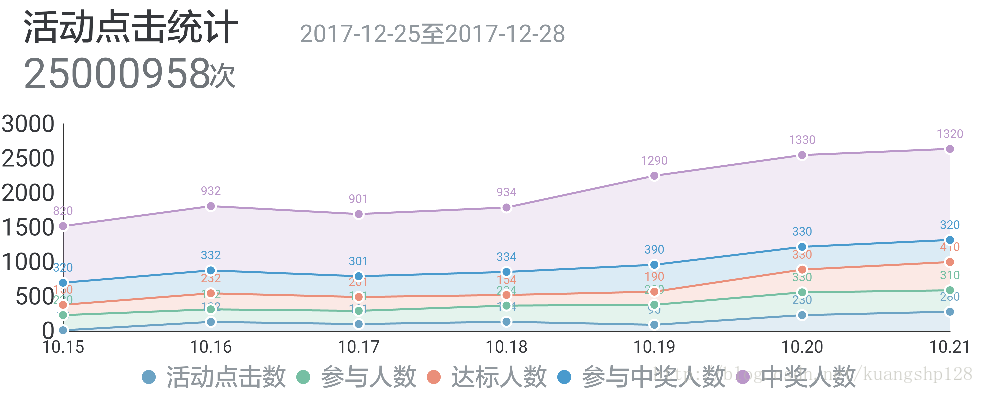
"legendData":['活动点击数', '参与人数', '达标人数', '参与中奖人数', '中奖人数'],
"xAxisData":["10.15", "10.16", "10.17", "10.18", "10.19", "10.20", "10.21"],
"axisLabelFormatter":false,
"seriesData":[
[120, 132, 101, 134, 90, 230, 280],
[220, 182, 191, 234, 290, 330, 310],
[150, 232, 201, 154, 190, 330, 410],
[320, 332, 301, 334, 390, 330, 320],
[820, 932, 901, 934, 1290, 1330, 1320]
]
});