参考:生信技能树 - 代码有所更新
获取单细胞测试数据
# devtools::install_github("satijalab/seurat-data")

library(SeuratData)

# AvailableData()

# InstallData("pbmc3k.SeuratData")

data(pbmc3k)

exp <- pbmc3k@assays$RNA@data

dim(exp)

# exp[1:5,1:5]

table(is.na(pbmc3k$seurat_annotations))

table(pbmc3k$seurat_annotations)

library(Seurat)

pbmc3k@active.ident <- pbmc3k$seurat_annotations

table(pbmc3k@active.ident)

deg <- FindMarkers(pbmc3k, ident.1 = "Naive CD4 T", ident.2 = "B")

# head(deg)

dim(deg)
GSEA分析
# if (!requireNamespace("BiocManager", quietly = TRUE))
#     install.packages("BiocManager")

# BiocManager::install("GSEABase")

library(GSEABase)
library(ggplot2)
library(clusterProfiler)
library(org.Hs.eg.db)

# API 1
geneList <- deg$avg_logFC
names(geneList) <- toupper(rownames(deg))
geneList <- sort(geneList, decreasing = T)
head(geneList)

# API 2
# gmtfile <- "../EllyLab//human/singleCell/MsigDB/msigdb.v7.4.symbols.gmt"

gmtfile <- "../EllyLab//human/singleCell/MsigDB/c5.go.bp.v7.4.symbols.gmt"

geneset <- read.gmt(gmtfile)

length(unique(geneset$ont))

egmt <- GSEA(geneList, TERM2GENE = geneset, minGSSize = 1, pvalueCutoff = 0.99, verbose = F)

# head(egmt)

gsea.out.df <- egmt@result

# gsea.out.df

# head(gsea.out.df$ID)

library(enrichplot)
出图 - 基因数据足够才够漂亮
options(repr.plot.width=6, repr.plot.height=4)
gseaplot2(egmt, geneSetID = "GOBP_ANTIGEN_RECEPTOR_MEDIATED_SIGNALING_PATHWAY", pvalue_table = T)
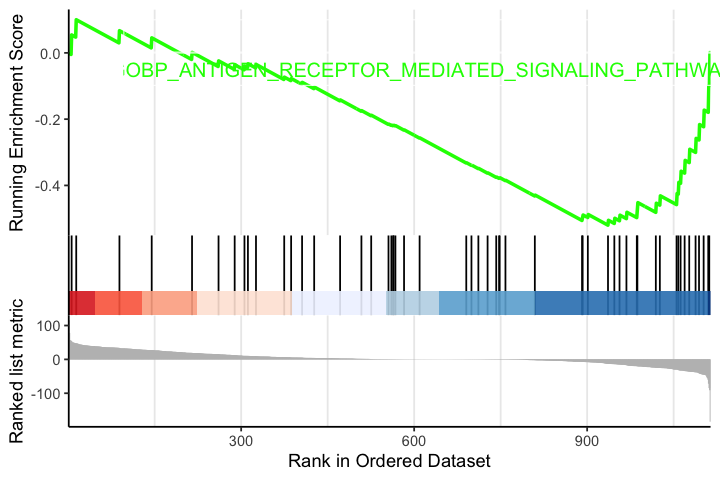
原始的图不够漂亮,优化可以参考阿汤哥的paper
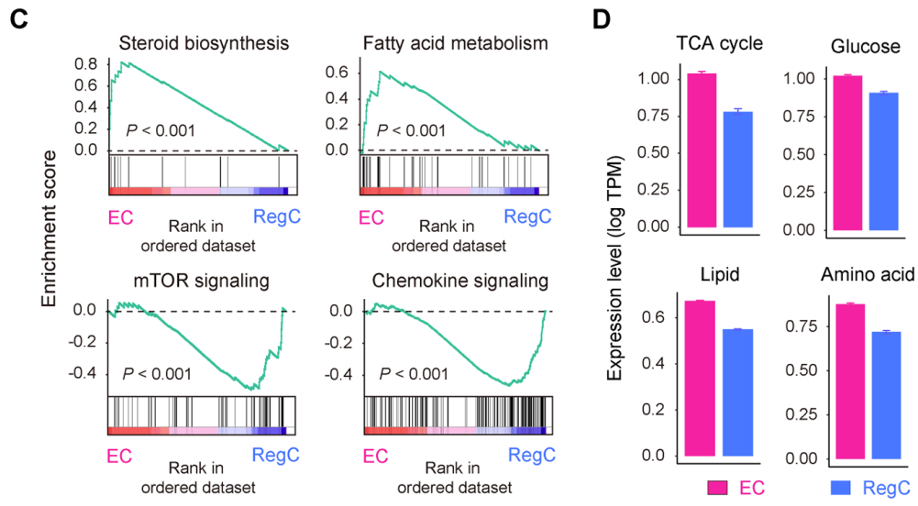
这个图的代码不错,不知道他们paper里有没有分享。
2019 - Single-cell RNA-seq analysis reveals the progression of human osteoarthritis