plt.lengend()
用于给图像加图例。
图例是集中于地图一角或一侧的地图上各种符号和颜色所代表内容与指标的说明,有助于更好的认识地图。
语法参数如下: matplotlib.pyplot.legend(*args, **kwargs)
| keyword | Description |
| loc | Location code string, or tuple (see below).图例所有figure位置 |
| prop | the font property字体参数 |
| fontsize | the font size (used only if prop is not specified) |
| markerscale | the relative size of legend markers vs. original
图例标记与原始标记的相对大小
|
| markerfirst | If True (default), marker is to left of the label.
如果为True,则图例标记位于图例标签的左侧
|
| numpoints | the number of points in the legend for line
为线条图图例条目创建的标记点数
|
| scatterpoints | the number of points in the legend for scatter plot
为散点图图例条目创建的标记点数
|
| scatteryoffsets | a list of yoffsets for scatter symbols in legend
为散点图图例条目创建的标记的垂直偏移量
|
| frameon | If True, draw the legend on a patch (frame).
控制是否应在图例周围绘制框架
|
| fancybox | If True, draw the frame with a round fancybox.
控制是否应在构成图例背景的FancyBboxPatch周围启用圆边
|
| shadow | If True, draw a shadow behind legend.
控制是否在图例后面画一个阴
|
| framealpha | Transparency of the frame.
控制图例框架的 Alpha 透明度
|
| edgecolor | Frame edgecolor. |
| facecolor | Frame facecolor. |
| ncol | number of columns 设置图例分为n列展示 |
| borderpad | the fractional whitespace inside the legend border
图例边框的内边距
|
| labelspacing | the vertical space between the legend entries
图例条目之间的垂直间距
|
| handlelength | the length of the legend handles
图例句柄的长度
|
| handleheight | the height of the legend handles
图例句柄的高度
|
| handletextpad | the pad between the legend handle and text
图例句柄和文本之间的间距
|
| borderaxespad | the pad between the axes and legend border
轴与图例边框之间的距离
|
| columnspacing | the spacing between columns 列间距 |
| title | the legend title |
| bbox_to_anchor | the bbox that the legend will be anchored.指定图例在轴的位置 |
| bbox_transform | the transform for the bbox. transAxes if None. |
常用的几个参数:
(1)设置图列位置
plt.legend(loc='upper center')
| 0: ‘best'
1: ‘upper right'
2: ‘upper left'
3: ‘lower left'
|
4: ‘lower right'
5: ‘right'
6: ‘center left'
|
7: ‘center right'
8: ‘lower center'
9: ‘upper center'
10: ‘center'
|
(2)设置图例字体大小
fontsize : int or float or {‘xx-small’, ‘x-small’, ‘small’, ‘medium’, ‘large’, ‘x-large’, ‘xx-large’}
(3)设置图例边框及背景
plt.legend(loc='best',frameon=False) #去掉图例边框
plt.legend(loc='best',edgecolor='blue') #设置图例边框颜色
plt.legend(loc='best',facecolor='blue') #设置图例背景颜色,若无边框,参数无效
对于边框还可以采用面向对象方式:
legend = plt.legend(["First", "Second"])
frame = legend.get_frame()
frame.set_facecolor('blue')
(4)设置图例标题
legend = plt.legend(["CH", "US"], title='China VS Us')
(5)设置图例名字及对应关系
legend = plt.legend([p1, p2], ["CH", "US"])
from matplotlib import pyplot as plt
import numpy as np

train_x = np.linspace(-1, 1, 100)
train_y_1 = 2*train_x + np.random.rand(*train_x.shape)*0.3
train_y_2 = train_x**2+np.random.randn(*train_x.shape)*0.3

p1 = plt.scatter(train_x, train_y_1, c='red', marker='v' )
p2= plt.scatter(train_x, train_y_2, c='blue', marker='o' )
legend = plt.legend([p1, p2], ["CH", "US"], facecolor='blue')

plt.show()
plt.scatter()
用于画散点图。
| x,y | X和Y是长度相同的数组 |
| s | size,点的大小,标量或与数据长度相同的数组 |
| c | color,点的颜色,标量或与数据长度相同的数组 |
| marker | MarketStyle,可选,点的形状,默认'o' |
| cmap | Colormap,可选,默认'None' |
| norm | Normalize,亮度设置,0-1 |
| vmin,vmax | 亮度设置 |
| alpha | 透明度,0-1 |
| linewidths |
其中散点的形状参数marker如下:

其中颜色参数c如下:

scatter(x, y, 点的大小, 颜色,标记),这是最主要的几个用法,如果括号中不写s= c=则按默认顺序,写了则按规定的来,不考虑顺序
import matplotlib.pyplot as plt

#x,y,大小,颜色
plt.scatter([1,2,3,4],[2,4,6,8],[10,20,30,400],['r', 'b','y','k'])
plt.scatter([1,2,3,4],[9,8,7,6],s=10,c='b', marker='v')

plt.show()
import numpy as np
import matplotlib.pyplot as plt

# Fixing random state for reproducibility
np.random.seed(19680801)


N = 50
x = np.random.rand(N)
y = np.random.rand(N)
colors = np.random.rand(N)
area = (30 * np.random.rand(N))**2  # 0 to 15 point radii

plt.scatter(x, y, s=area, c=colors, alpha=0.5)
plt.show()

plt.plot()
一个通用命令,将(x, y)绘制成线条或散点图。
| x, y | 数据,x是可选的,默认range(len(y)) |
| fmt | format,格式,形状,例如,'ro'表示红圈 |
| data | 标有数据的对象,可选 |
其中,线条的格式还可以使用如下线属性:
| alpha | float,透明度 |
| fillstyle | {'full', 'left', 'right', 'bottom', 'top', 'none'} |
| linestyle/ls | {'-', '--', '-.', ':', '', (offset, on-off-seq), ...} |
| linewidth/lw | float |
| marker | marker style |
| markeredgecolor/mec | color |
| markeredgewidth/mew | float |
| markerfacecolor/mfc | color |
| markersize/ms | float |
| ... | ... |
当线属性与fmt冲突时,线属性优先。
一些默认的写法:
>>> plot(x, y)        # plot x and y using default line style and color
>>> plot(x, y, 'bo')  # plot x and y using blue circle markers
>>> plot(y)           # plot y using x as index array 0..N-1
>>> plot(y, 'r+')     # ditto, but with red plusses
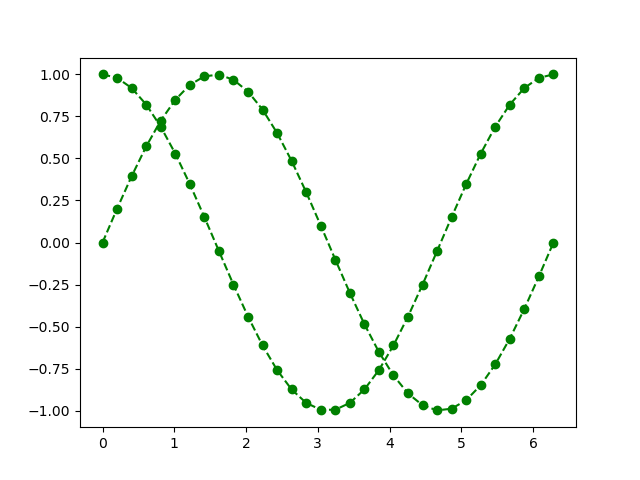
import numpy as np
import matplotlib.pyplot as plt

X = np.linspace(0, 2*np.pi, 32, endpoint=True)
C,S = np.cos(X), np.sin(X)

#plt.plot(X,C)
#plt.plot(X,S)
plt.plot(X, C, 'go--')
plt.plot(X,S, color='green', marker='o', linestyle='dashed')
# 一个是fmt,一个是线属性,但是它们的格式是一样的

plt.show()
plt.figure()
用于创建一个新图。
| num | 新图的编号,默认递增 |
| figsize | 宽度,高度,以英寸为单位 |
| dpi | 分辨率,整数 |
| facecolor | 背景颜色 |
| edgecolor | 边框颜色 |
| frameon | 若为False,则没有边框 |
| clear | 若为True,如果图的编号已存在则先清除 |
如果有多个figure,请显示的调用 pyplot.close() 关闭你不需要使用的figure,以便pyplot能正确的清理内存。
import numpy as np
import matplotlib.pyplot as plt

X = np.linspace(0, 2*np.pi, 32, endpoint=True)
C,S = np.cos(X), np.sin(X)

plt.figure(num=1)
plt.plot(X,C)
#plt.close()

plt.figure(2)
plt.plot(X,S)

plt.figure(3)
plt.plot([1, 2, 3, 4], [1, 4, 9, 16])

plt.show()
会连续展现三张图,注意与下面subplot的区别。
对于只有一张图时,也有作用,例如设置尺寸和分辨率等:
# 创建一个8x6大小的figure,并设置每英寸80个像素点
plt.figure(figsize=(8, 6), dpi=80)
plt.subplot()
用于在一个Figure对象里画多个子图(Axes)。
其调用格式:subplot(numRows, numCols, plotNum),即(行、列、序号)。
图表的整个绘图区域被分成numRows行和numCols列,plotNum参数指定创建的Axes对象所在的区域(左上角序号为1)
如果行数、列数和序号都是个位数可以简写成一个整数,否则需要用逗号隔开。
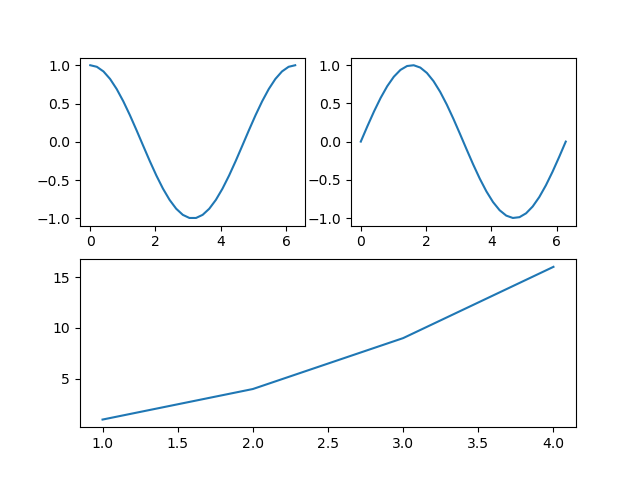
import numpy as np
import matplotlib.pyplot as plt

X = np.linspace(0, 2*np.pi, 32, endpoint=True)
C,S = np.cos(X), np.sin(X)

plt.subplot(221)
plt.plot(X,C)

plt.subplot(2,2,2) #可以隔开,也可以不隔开
plt.plot(X,S)

plt.subplot(212)
plt.plot([1, 2, 3, 4], [1, 4, 9, 16])

plt.show()
参考链接:
1. CSDN开码牛-matplotlib命令与格式:图例legend语法及设置
2. CSDNweixin_41950276-plt.legend( )函数,给图像加上图例
3. matplotlib.pyplot.legend官方文档
4. CSDNxiaodaicai4452-python绘图基础—scatter用法
5. matplotlib.pyplot.scatter官方文档