1. 矩阵:numpy.mat
1.1 设置 0 元素:numpy.zeros
例子:
import numpy as np
print(np.zeros((3,3)))
输出
[[0. 0. 0.]
 [0. 0. 0.]
 [0. 0. 0.]]
1.2 设置矩阵
例子:
p = np.mat(np.zeros((n,n)))
print(p)
1.3 矩阵相乘
直接用符号 * 即可,例如:
n = 3
a = np.mat(np.random.rand(n,n))
b = np.mat(np.random.rand(n,n))
c = a * b
2. 随机数:numpy.random
2.1 [0,1) 上均匀分布随机数:numpy.rand()
例如:
n = 3
a = np.mat(np.random.rand(n,n))
2.2 e指数分布:numpy.random.exponential
e指数分布:
[f(x; frac{1}{eta}) = frac{1}{eta} exp(-frac{x}{eta}), ~~ scale = frac{1}{eta}
]
例如:
np.random.exponential(2.0,10000) # 10000 sampling points in (0, 1/2), with exponential distribution.
3. 画图
3.1 散点图
3.2 折线图
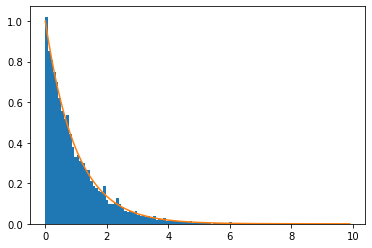
3.3 柱状图
例子:
import numpy as np
from matplotlib import pyplot as plt
#help(plt.hist)
p = np.random.exponential(1.0,10000)
plt.hist(p,100,density=True)
x = np.arange(0,10,0.1)
y = np.exp(-x)
plt.plot(x,y)
结果:
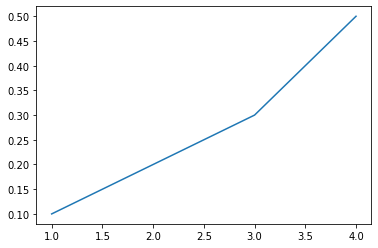
3.4 读取 txt 文件中呈阵列的数据
我们经常用代码计算产生数据,m行 x n列的形式,打印到文本文件中。可以用几行 python 代码读取出来,进行画图。
例如数据文件 haha.txt 中的内容如下:
1       0.1
2       0.2
3       0.3
4       0.5
下面的 python 代码读取它,然后做折线图:
import numpy as np
import matplotlib.pyplot as plt
data = np.loadtxt("haha.txt")
a = data[:,0] # the 1st column
b = data[:,1] # the 2nd column
plt.plot(a,b)