浅层神经网络,这里使用的是一个输入层,一个隐层(4个神经元), 一个输出层
使用sigmoid函数做激活函数,在进行反向传播的梯度下降中,由于导数过小,速度下降会变得很慢,使用非线性激活函数,是为了使得中间层神经元连接是存在意义的.
一般我们在初始化w时,采用随机值做初始化,为了使得不同样本输入,在第一次卷积以后是存在差异的,对于b可以采用0作为初始化.
sigmoid函数的导数: A(1-A) A与下面的A1相同表示
tanh函数的导数: 1- A^2
relu 函数的导数: if z < 0 : 0 if z > 0 : 1
前向传播函数:
Z1 = w1 * X + b1
A1 = g(z1) # g 表示使用tanh函数
Z2 = w2 * A1 + b2
A2 = s(Z2) #s 表示使用sigmoid函数
反向传播函数:
dZ2 = A2 - Y
dW2 = np.dot(dZ2 * A1.T)
db2 = np.sum(dZ2)
dA1 = np.dot(W2.T, dZ2)
dZ1 = dA1 * (1-np.power(A1, 2))
dW1 = np.dot(dZ1, X.T)
db1 = np.sum(dZ1)
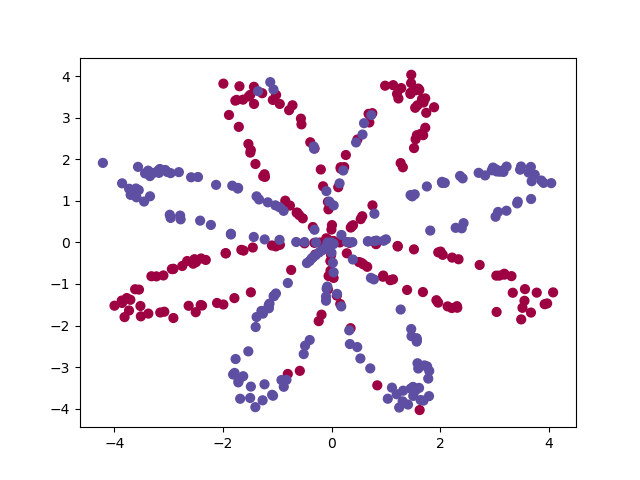
通过一个样本点来进行说明
第一步:生成样本点
def load_planar_dataset():
    np.random.seed(1)
    m = 400  # number of examples
    N = int(m / 2)  # number of points per class
    D = 2  # dimensionality
    X = np.zeros((m, D))  # data matrix where each row is a single example
    Y = np.zeros((m, 1), dtype='uint8')  # labels vector (0 for red, 1 for blue)
    a = 4  # maximum ray of the flower

    for j in range(2):
        ix = range(N * j, N * (j + 1))
        t = np.linspace(j * 3.12, (j + 1) * 3.12, N) + np.random.randn(N) * 0.2  # theta
        r = a * np.sin(4 * t) + np.random.randn(N) * 0.2  # radius
        X[ix] = np.c_[r * np.sin(t), r * np.cos(t)]
        Y[ix] = j

    X = X.T
    Y = Y.T

    return X, Y
 样本点的图像
第二步:输出样本的特征维度
def layer_size(X, Y):

    n_x = X.shape[0]
    n_h = 4
    n_y = Y.shape[0]

    return n_x, n_y
第三步:初始化参数, w采用np.random.randn进行随机参数设定, b采用0来代替
def initial_parameters(n_x, n_h, n_y):
   # w_1 的结构(4,2)
    w_1 = np.random.randn(n_h, n_x) * 0.02
    # b_1 的结构 (4,  1)
    b_1 = np.zeros((n_h, 1))
    # w_2 的结构为(1, 4)
    w_2 = np.random.randn(n_y, n_h) * 0.02
    # b_2 的结构为(1, 1)
    b_2 = np.zeros((n_y, 1))

    params = {
        'W_1':w_1,
        'b_1':b_1,
        'W_2':w_2,
        'b_2':b_2,

    }
    return params
第四步: 定义sigmoid函数 和 前向传播函数
def forward_propagation(X, parameters):


    W_1 = parameters['W_1']
    b_1 = parameters['b_1']
    W_2 = parameters['W_2']
    b_2 = parameters['b_2']


    Z1 = np.dot(W_1, X) + b_1
    A1 = np.tanh(Z1)
    Z2 = np.dot(W_2, A1) + b_2
    A2 = sigmoid(Z2)


    cache = {'Z1':Z1,
             'A1':A1,
             'Z2':Z2,
             'A2':A2}

    return cache, A2
第5步:定义损失函数
# 计算损失函数
def compute_cost(A2, Y, parameters):

    m = Y.shape[0]
    # np.multiply # 对应位置相乘
    nplogloss = np.multiply(np.log(A2), Y) + np.multiply(np.log(1-A2), (1-Y))
    # 把损失函数进行相加
    cost = -np.sum(nplogloss) / m

    cost = np.squeeze(cost)
    return cost
第6步: 定义反向传播函数
def backward_propagation(X, Y, parameters):

    cache, A2 = forward_propagation(X, parameters)

    W1 = parameters['W_1']
    W2 = parameters['W_2']

    A1 = cache['A1']
    A2 = cache['A2']

    # 第一次反向传播
    # np.dot 执行矩阵运算
    dZ2 = A2 - Y
    dW2 = np.dot(dZ2, A1.T) / m
    db2 = np.sum(dZ2, axis=1, keepdims=True) / m
    dA1 = np.dot(W2.T, dZ2)
    dZ1 = dA1 * (1 - np.power(A1, 2))
    dW1 = np.dot(dZ1, X.T) / m
    db1 = np.sum(dZ1, axis=1, keepdims=True) / m

    grade = {
        'dW2':dW2,
        'db2':db2,
        'dW1':dW1,
        'db1':db1,
    }

    return grade
第7步: 定义一次参数更新
def update_parameters(parameter, grade, learning_rate=1.2):

    W_1 = parameter['W_1']
    b_1 = parameter['b_1']
    W_2 = parameter['W_2']
    b_2 = parameter['b_2']

    dW2 = grade['dW2']
    db2 = grade['db2']
    dW1 = grade['dW1']
    db1 = grade['db1']

    W_2 = W_2 - learning_rate * dW2
    b_2 = b_2 - learning_rate * db2
    W_1 = W_1 - learning_rate * dW1
    b_1 = b_1 - learning_rate * db1

    parameter = {
        'W_2' : W_2,
        'b_2' : b_2,
        'W_1' : W_1,
        'b_1' : b_1
    }

    return parameter
第8步:构建主体模型
def nn_model(X, Y, n_h, num_iteration=1000, print_cost=False):
    # n_x, n_y 的
    n_x, n_y =  layer_size(X, Y)
    # 创建初始化参数np.random.randn
    parameter=initial_parameters(n_x, n_h, n_y)

    # 进行参数更新

    for i in range(num_iteration):
        # 计算前向传播的结果
        cache, A2 = forward_propagation(X, parameter)
        # 计算损失函数
        cost = compute_cost(A2, Y, parameter)
        # 反向传播
        grade = backward_propagation(X, Y, parameter)
        # 参数更新
        parameter = update_parameters(parameter, grade, learning_rate=1.2)


        if print_cost and i%1000 == 0:
            print(i, cost)

    # 返回更新的参数
    return parameter
第9步:根据前向传播构建预测模型
def predict(parameter, X):

    cache, A2 = forward_propagation(X, parameter)
    # 输出True和False
    prediction = A2 > 0.5

    return prediction
第10步:运行函数
parameter = nn_model(X, Y, 4, num_iteration=10000, print_cost=False)

print(X.shape, Y.shape)
#lambda x: predict(parameter, x.T) 表示一个输入参数model, x为输入的值,输出 predict(parameter, x.T)
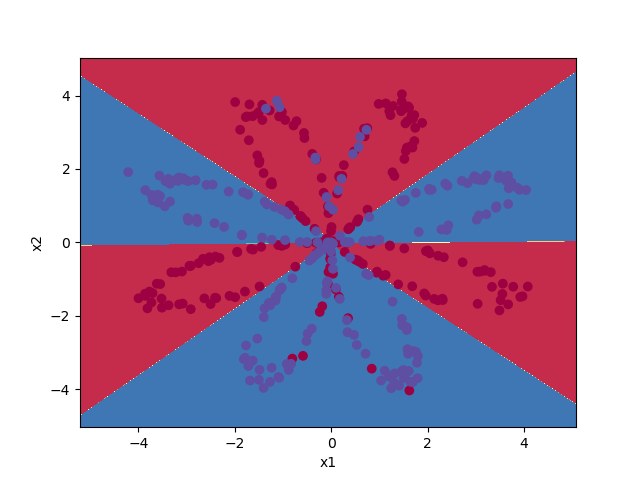
plot_decision_boundary(lambda x: predict(parameter, x.T), X, Y)
plt.title("Decision Boundary for hidden layer size " + str(4))
加一个画图的函数
def plot_decision_boundary(model, X, y):
    # Set min and max values and give it some padding
    x_min, x_max = X[0, :].min() - 1, X[0, :].max() + 1
    y_min, y_max = X[1, :].min() - 1, X[1, :].max() + 1
    h = 0.01
    # Generate a grid of points with distance h between them
    xx, yy = np.meshgrid(np.arange(x_min, x_max, h), np.arange(y_min, y_max, h))
    # Predict the function value for the whole grid
    Z = model(np.c_[xx.ravel(), yy.ravel()])
    Z = Z.reshape(xx.shape)
    # Plot the contour and training examples, Z的维度与xx.shape 相等
    plt.contourf(xx, yy, Z, cmap=plt.cm.Spectral)
    plt.ylabel('x2')
    plt.xlabel('x1')
    # 把 np.squeeze(y) 把 y 转换为列表形式
    plt.scatter(X[0, :], X[1, :], c=np.squeeze(y), cmap=plt.cm.Spectral)
    plt.show()
最后的效果图, 总体来说效果还是不错的,就是图有点丑
