def huitu_host(nodes,total):
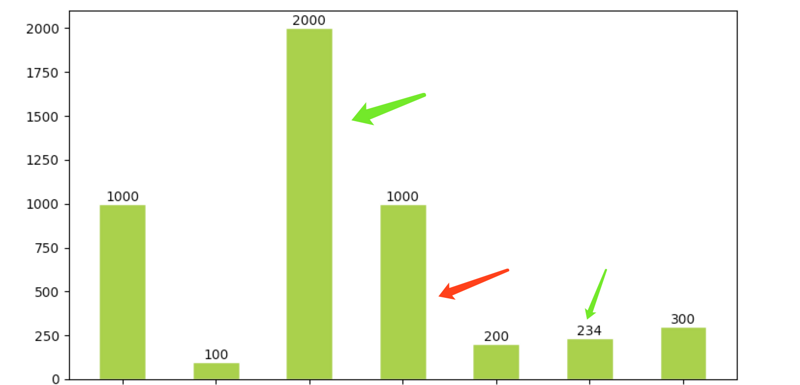
    x = np.arange(len(nodes))
    plt.figure(figsize=(9,5))
    plt.xticks(x,nodes)
    plt.bar(x,total,width = 0.5,facecolor = 'yellowgreen',edgecolor = 'white')
    for x,y in zip(x,total):
        plt.text(x,y,'%.f' % y,ha="center", va="bottom")
    plt.show()
    return
