dstat 监控工具
Linux 自带的监控工具。界面相当友好,可以替代其他的监控工具。
安装
yum install -y dstat
命令使用
dstat -h                                        # 帮助
dstat -tpcdrmgln                                # 屏幕刷新
dstat -tpcdrmgln 5 10                           # 5s刷新一次,刷新10次
nohup dstat -tpcdrmgln 5 --output dstat.csv &   # 将每5s的结果输出到csv ,可以放到后台跑
命令演示
1.屏幕输出

2. 记录到CSV文件
nohup dstat -tpcdrmgln --output dstat.csv &
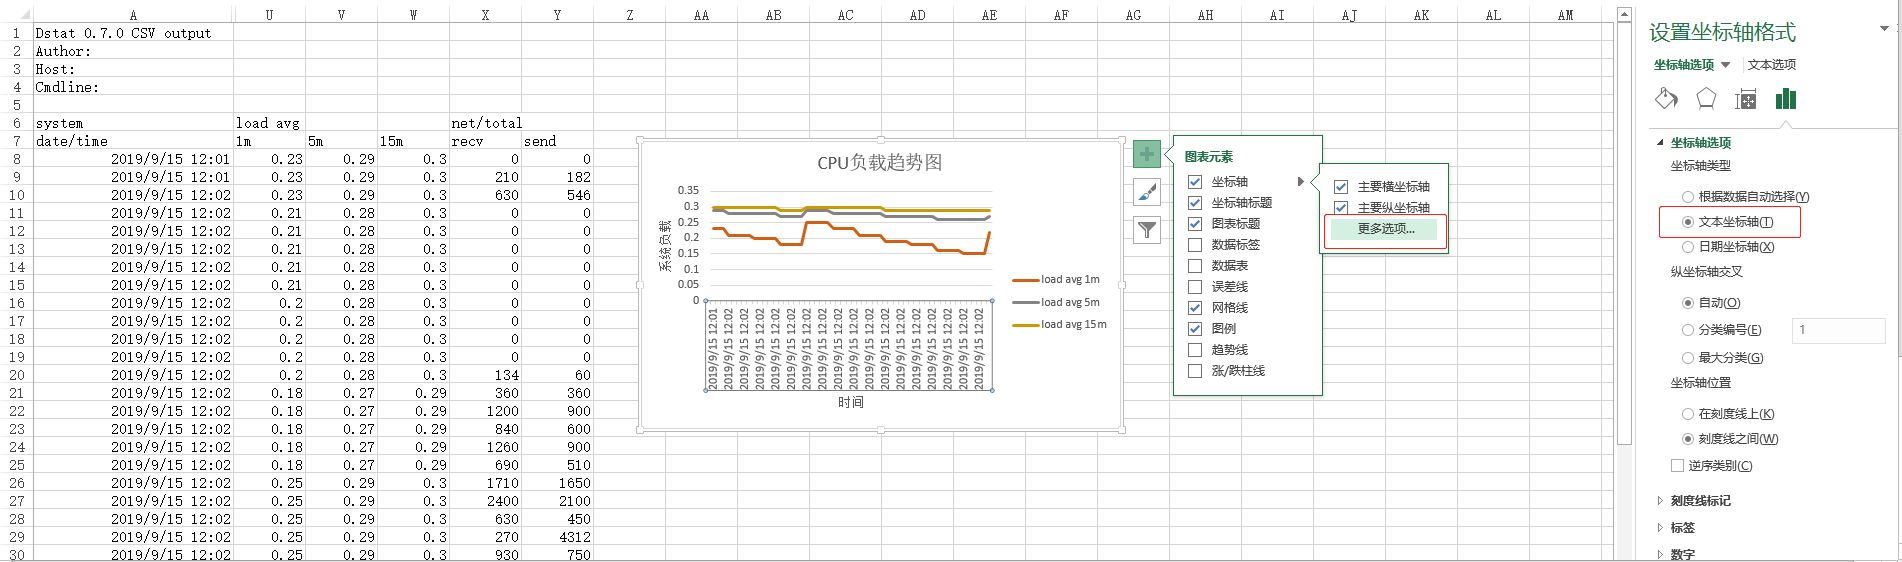
下载文件后,可用Excel生成趋势图表,类似:
帮助信息
[oracle@oracle ~]$ dstat -h
Usage: dstat [-afv] [options..] [delay [count]]
Versatile tool for generating system resource statistics

Dstat options:
  -c, --cpu              enable cpu stats
     -C 0,3,total           include cpu0, cpu3 and total
  -d, --disk             enable disk stats
     -D total,hda           include hda and total
  -g, --page             enable page stats
  -i, --int              enable interrupt stats
     -I 5,eth2              include int5 and interrupt used by eth2
  -l, --load             enable load stats
  -m, --mem              enable memory stats
  -n, --net              enable network stats
     -N eth1,total          include eth1 and total
  -p, --proc             enable process stats
  -r, --io               enable io stats (I/O requests completed)
  -s, --swap             enable swap stats
     -S swap1,total         include swap1 and total
  -t, --time             enable time/date output
  -T, --epoch            enable time counter (seconds since epoch)
  -y, --sys              enable system stats

  --aio                  enable aio stats
  --fs, --filesystem     enable fs stats
  --ipc                  enable ipc stats
  --lock                 enable lock stats
  --raw                  enable raw stats
  --socket               enable socket stats
  --tcp                  enable tcp stats
  --udp                  enable udp stats
  --unix                 enable unix stats
  --vm                   enable vm stats

  --plugin-name          enable plugins by plugin name (see manual)
  --list                 list all available plugins

  -a, --all              equals -cdngy (default)
  -f, --full             automatically expand -C, -D, -I, -N and -S lists
  -v, --vmstat           equals -pmgdsc -D total

  --bw, --blackonwhite   change colors for white background terminal
  --float                force float values on screen
  --integer              force integer values on screen
  --nocolor              disable colors (implies --noupdate)
  --noheaders            disable repetitive headers
  --noupdate             disable intermediate updates
  --output file          write CSV output to file

delay is the delay in seconds between each update (default: 1)
count is the number of updates to display before exiting (default: unlimited)