https://en.wikipedia.org/wiki/Memory_leak
In computer science, a memory leak is a type of resource leak that occurs when a computer program incorrectly manages memory allocations[1] in such a way that memory which is no longer needed is not released. In object-oriented programming, a memory leak may happen when an object is stored in memory but cannot be accessed by the running code.[2] A memory leak has symptoms similar to a number of other problems and generally can only be diagnosed by a programmer with access to the program's source code.
Because they can exhaust available system memory as an application runs, memory leaks are often the cause of or a contributing factor to software aging.
下面是一个C语言的例子,在函数f()中申请了内存却没有释放,导致内存泄漏。当程序不停地重复调用这个有问题的函数f,申请内存函数malloc()最后会在程序没有更多可用存储器可以申请时产生错误(函数输出为NULL)。但是,由于函数malloc()输出的结果没有加以出错处理,因此程序会不停地尝试申请存储器,并且在系统有新的空闲内存时,被该程序占用。注意,malloc()返回NULL的原因不一定是因为前述的没有更多可用存储器可以申请,也可能是逻辑地址空间耗尽,在Linux环境上测试的时候后者更容易发生。
#include <stdio.h>
#include <stdlib.h>
void f(void) {
    void *s;
    s = malloc(50);
    return;
}

int main(void) {
    while(1>0)f();
    return 0;
}
s = malloc(50); /* 申请内存空间 */
* s 指向新分配的堆空间。
* 当此函数返回,离开局部变量s的作用域后将无法得知s的值,
* 分配的内存空间不能被释放。
*
* 如要「修复」这个问题,必须想办法释放分配的堆空间,
* 也可以用alloca(3)代替malloc(3)。
* (注意:alloca(3)既不是ANSI函数也不是POSIX函数)
https://zh.wikipedia.org/wiki/内存泄漏
在此例中的应用程序是一个简单软件的一小部分,用来控制升降机的运作。此部分软件当乘客在升降机内按下一楼层的按钮时运行。
当按下按钮时:
- 要求使用存储器,用作记住目的楼层
- 把目的楼层的数字储存到存储器中
- 升降机是否已到达目的楼层?
- 如是,没有任何事需要做:程序完成
- 否则:
- 等待直至升降机停止
- 到达指定楼层
- 释放刚才用作记住目的楼层的存储器
此程序有一处会造成存储器泄漏:如果在升降机所在楼层按下该层的按钮(即上述程序的第4步),程序将触发判断条件而结束运行,但存储器仍一直被占用而没有被释放。这种情况发生得越多,泄漏的存储器也越多。
这个小错误不会造成即时影响。因为人不会经常在升降机所在楼层按下同一层的按钮。而且在通常情况下,升降机应有足够的存储器以应付上百次、上千次类似的情况。不过,升降机最后仍有可能消耗完所有存储器。这可能需要数个月或是数年,所以在简单的测试下这个问题不会被发现。
而这个例子导致的后果会是不那么令人愉快。至少,升降机不会再理会前往其他楼层的要求。更严重的是,如果程序需要存储器去打开升降机门,那可能有人被困升降机内,因为升降机没有足够的存储器去打开升降机门。
存储器泄漏只会在程序运行的时间内持续。例如:关闭升降机的电源时,程序终止运行。当电源再度打开,程序会再次运行而存储器会重置,而这种缓慢的泄漏则会从头开始再次发生。
Handling memory leaks in Java programs
Find out when memory leaks are a concern and how to prevent them
How memory leaks manifest themselves in Java programs
Most programmers know that one of the beauties of using a programming language such as Java is that they no longer have to worry about allocating and freeing memory. You simply create objects, and Java takes care of removing them when they are no longer needed by the application through a mechanism known as garbage collection. This process means that Java has solved one of the nasty problems that plague other programming languages -- the dreaded memory leak. Or has it?
Before we get too deep into our discussion, let's begin by reviewing how garbage collection actually works. The job of the garbage collector is to find objects that are no longer needed by an application and to remove them when they can no longer be accessed or referenced. The garbage collector starts at the root nodes, classes that persist throughout the life of a Java application, and sweeps through all of the nodes that are referenced. As it traverses the nodes, it keeps track of which objects are actively being referenced. Any classes that are no longer being referenced are then eligible to be garbage collected. The memory resources used by these objects can be returned to the Java virtual machine (JVM) when the objects are deleted.
So it is true that Java code does not require the programmer to be responsible for memory management cleanup, and that it automatically garbage collects unused objects. However, the key point to remember is that an object is only counted as being unused when it is no longer referenced. Figure 1 illustrates this concept.
【many times member variables of a class that point to other classes simply need to be set to null at the appropriate time】
Figure 1. Unused but still referenced
The figure illustrates two classes that have different lifetimes during the execution of a Java application. Class A is instantiated first and exists for a long time or for the entire life of the program. At some point, class B is created, and class A adds a reference to this newly created class. Now let's suppose class Bis some user interface widget that is displayed and eventually dismissed by the user. Even though class B is no longer needed, if the reference that class A has to class B is not cleared, class B will continue to exist and to take up memory space even after the next garbage collection cycle is executed.
When are memory leaks a concern?
If your program is getting a java.lang.OutOfMemoryError after executing for a while, a memory leak is certainly a strong suspect. Beyond this obvious case, when should memory leaks become a concern? The perfectionist programmer would answer that all memory leaks need to be investigated and corrected. However, there are several other points to consider before jumping to this conclusion, including the lifetime of the program and the size of the leak.
Consider the possibility that the garbage collector may never even run during an application's lifetime. There is no guarantee as to when or if the JVM will invoke the garbage collector -- even if a program explicitly calls System.gc(). Typically, the garbage collector won't be automatically run until a program needs more memory than is currently available. At this point, the JVM will first attempt to make more memory available by invoking the garbage collector. If this attempt still doesn't free enough resources, then the JVM will obtain more memory from the operating system until it finally reaches the maximum allowed.
Take, for example, a small Java application that displays some simple user interface elements for configuration modifications and that has a memory leak. Chances are that the garbage collector will not even be invoked before the application closes, because the JVM will probably have plenty of memory to create all of the objects needed by the program with leftover memory to spare. So, in this case, even though some dead objects are taking up memory while the program is being executed, it really doesn't matter for all practical purposes.
If the Java code being developed is meant to run on a server 24 hours a day, then memory leaks become much more significant than in the case of our configuration utility. Even the smallest leak in some code that is meant to be continuously run will eventually result in the JVM exhausting all of the memory available.
And in the opposite case where a program is relatively short lived, memory limits can be reached by any Java code that allocates a large number of temporary objects (or a handful of objects that eat up large amounts of memory) that are not de-referenced when no longer needed.
One last consideration is that the memory leak isn't a concern at all. Java memory leaks should not be considered as dangerous as leaks that occur in other languages such as C++ where memory is lost and never returned to the operating system. In the case of Java applications, we have unneeded objects clinging to memory resources that have been given to the JVM by the operating system. So in theory, once the Java application and its JVM have been closed, all allocated memory will be returned to the operating system.
Determining if an application has memory leaks
To see if a Java application running on a Windows NT platform is leaking memory, you might be tempted to simply observe the memory settings in Task Manager as the application is run. However, after observing a few Java applications at work, you will find that they use a lot of memory compared to native applications. Some Java projects that I have worked on can start out using 10 to 20 MB of system memory. Compare this number to the native Windows Explorer program shipped with the operating system, which uses something on the order of 5 MB.
The other thing to note about Java application memory use is that the typical program running with the IBM JDK 1.1.8 JVM seems to keep gobbling up more and more system memory as it runs. The program never seems to return any memory back to the system until a very large amount of physical memory has been allocated to the application. Could these situations be signs of a memory leak?
To understand what is going on, we need to familiarize ourselves with how the JVM uses system memory for its heap. When running java.exe, you can use certain options to control the startup and maximum size of the garbage-collected heap (-ms and -mx, respectively). The Sun JDK 1.1.8 uses a default 1 MB startup setting and a 16 MB maximum setting. The IBM JDK 1.1.8 uses a default maximum setting of one-half the total physical memory size of the machine. These memory settings have a direct impact on what the JVM does when it runs out of memory. The JVM may continue growing the heap rather than wait for a garbage collection cycle to complete.
So for the purposes of finding and eventually eliminating a memory leak, we are going to need better tools than task monitoring utility programs. Memory debugging programs (see Related topics) can come in handy when you're trying to detect memory leaks. These programs typically give you information about the number of objects in the heap, the number of instances of each object, and the memory being using by the objects. In addition, they may also provide useful views showing each object's references and referrers so that you can track down the source of a memory leak.
Next, I will show how I detected and removed a memory leak using the JProbe debugger from Sitraka Software to give you some idea of how these tools can be deployed and the process required to successfully remove a leak.
A memory leak example
This example centers on a problem that manifested itself after a tester spent several hours working with a Java JDK 1.1.8 application that my department was developing for commercial release. The underlying code and packages to this Java application were developed by several different groups of programmers over time. The memory leaks that cropped up within the application were caused, I suspect, by programmers who did not truly understand the code that had been developed elsewhere.
The Java code in question allowed a user to create applications for a Palm personal digital assistant without having to write any Palm OS native code. By using a graphical interface, the user could create forms, populate them with controls, and then wire events from these controls to create the Palm application. The tester discovered that the Java application eventually ran out of memory as he created and deleted forms and controls over time. The developers hadn't detected the problem because their machines had more physical memory.
To investigate this problem, I used JProbe to determine what was going wrong. Even with the powerful tools and memory snapshots that JProbe provides, the investigation turned out to be a tedious, iterative process that involved first determining the cause of a given memory leak and then making code changes and verifying the results.
JProbe has several options to control what information is actually recorded during a debugging session. After some experimentation, I decided that the most efficient way to get the information I needed was to turn off the performance data collection and concentrate on the captured heap data. JProbe provides a view called the Runtime Heap Summary that shows the amount of heap memory in use over time as the Java application is running. It also provides a toolbar button to force the JVM to perform garbage collection when desired. This capability turned out to be very useful when trying to see if a given instance of a class would be garbage collected when it was no longer needed by the Java application. Figure 2 shows the amount of heap storage that is in use over time.
Figure 2. Runtime Heap Summary
In the Heap Usage Chart, the blue portion indicates the amount of heap space that has been allocated. After I started the Java program and it reached a stable point, I forced the garbage collector to run, which is indicated by the sudden drop in the blue curve before the green line (this line indicates a checkpoint was inserted). Next, I added, then deleted four forms and again invoked the garbage collector. The fact that the level blue area after the checkpoint is higher than the level blue area before the checkpoint tells us that a memory leak is likely, as the program has returned to its initial state of only having a single visible form. I confirmed the leak by looking at the Instance Summary, which indicates that the FormFrame class (which is the main UI class for the forms) has increased in count by four after the checkpoint.
Finding the cause
My first step in trying to isolate the problems reported by the tester was to come up with some simple, reproducible test cases. For this example, I found that simply adding a form, deleting the form, and then forcing a garbage collection resulted in many class instances associated with the deleted form to still be alive. This problem was apparent in the JProbe Instance Summary view, which counts the number of instances that are on the heap for each Java class.
To pinpoint the references that were keeping the garbage collector from properly doing its job, I used JProbe's Reference Graph, shown in Figure 3, to determine which classes were still referencing the now-deleted FormFrame class. This process turned out to be one of the trickiest aspects of debugging this problem as I discovered many different objects were still referencing the unused object. The trial-and-error process of figuring out which of these referrers was truly causing the problem was quite time consuming.
In this case, a root class (upper-left corner in red) is where the problem originated. The class that is highlighted in blue on the right is along the path that has been traced from the original FormFrame class.
Figure 3. Tracing a memory leak in a reference graph
For this specific example, it turned out that the primary culprit was a font manager class that contained a static hashtable. After tracing back through the list of referrers, I found that the root node was a static hashtable that stored the fonts in use for each form. The various forms could be zoomed in or out independently, so the hashtable contained a vector with all of the fonts for a given form. When the zoom view of the form was changed, the vector of fonts was fetched and the appropriate zoom factor was applied to the font sizes.
The problem with this font manager class was that while the code put the font vector into the hashtable when the form was created, no provision was ever made to remove the vector when the form was deleted. Therefore, this static hashtable, which essentially existed for the life of the application itself, was never removing the keys that referenced each form. Consequently, the form and all of its associated classes were left dangling in memory.
Applying a fix
The simple solution to this problem was to add a method to the font manager class that allowed the hashtable's remove() method to be called with the appropriate key when the form was deleted by the user. The removeKeyFromHashtables() method is shown below:
|
1
2
3
4
5
6
|
public void removeKeyFromHashtables(GraphCanvas graph) { if (graph != null) { viewFontTable.remove(graph); // remove key from hashtable // to prevent memory leak }} |
Next, I added a call to this method to the FormFrame class. FormFrame uses Swing's internal frames to actually implement the form UI, so the call to the font manager was added to the method that is executed when an internal frame has completely closed, as shown here:
|
1
2
3
4
5
6
7
8
9
|
/*** Invoked when a FormFrame is disposed. Clean out references to prevent * memory leaks.*/public void internalFrameClosed(InternalFrameEvent e) { FontManager.get().removeKeyFromHashtables(canvas); canvas = null; setDesktopIcon(null);} |
After I made these code changes, I used the debugger to verify that the object count associated with the deleted form decreased when the same test case was executed.
Preventing memory leaks
You can prevent memory leaks by watching for some common problems. Collection classes, such as hashtables and vectors, are common places to find the cause of a memory leak. This is particularly true if the class has been declared static and exists for the life of the application.
Another common problem occurs when you register a class as an event listener without bothering to unregister when the class is no longer needed. Also, many times member variables of a class that point to other classes simply need to be set to null at the appropriate time.
Conclusion
Finding the cause of a memory leak can be a tedious process, not to mention one that will require special debugging tools. However, once you become familiar with the tools and the patterns to look for in tracing object references, you will be able to track down memory leaks. In addition, you'll gain some valuable skills that may not only save a programming project, but also provide insight as to what coding practices to avoid to prevent memory leaks in future projects.
【If your program is getting a java.lang.OutOfMemoryError after executing for a while, a memory leak is certainly a strong suspect.】
Java常见的几种内存溢出及解决方案 - 平凡希 - 博客园 https://www.cnblogs.com/xiaoxi/p/7406903.html
1.JVM Heap(堆)溢出:java.lang.OutOfMemoryError: Java heap space
JVM在启动的时候会自动设置JVM Heap的值, 可以利用JVM提供的-Xmn -Xms -Xmx等选项可进行设置。Heap的大小是Young Generation 和Tenured Generaion 之和。在JVM中如果98%的时间是用于GC,且可用的Heap size 不足2%的时候将抛出此异常信息。
解决方法:手动设置JVM Heap(堆)的大小。
Java堆用于储存对象实例。当需要为对象实例分配内存,而堆的内存占用又已经达到-Xmx设置的最大值。将会抛出OutOfMemoryError异常。例子如下:

package com.demo.test;

import java.util.ArrayList;
import java.util.List;

/**
 * VM Args: -Xms5m -Xmx5m
 */
public class HeapOOM {

    public static void main(String[] args) {
        int count = 0;
        List<Object> list = new ArrayList<Object>();
        while(true){
            list.add(new Object());
            System.out.println(++count);
        }
    }

}
然后在运行时设置jvm参数,如下:
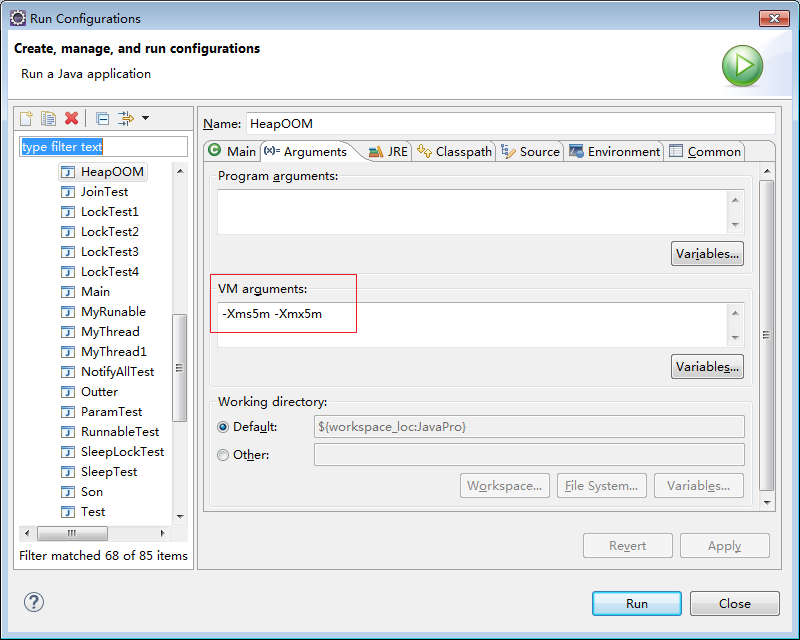
-Xmx为5m。其中的一次测试结果为,当count的值累加到360145时,发生如下异常:
Exception in thread "main" java.lang.OutOfMemoryError: Java heap space
    at java.util.Arrays.copyOf(Arrays.java:2245)
    at java.util.Arrays.copyOf(Arrays.java:2219)
    at java.util.ArrayList.grow(ArrayList.java:213)
    at java.util.ArrayList.ensureCapacityInternal(ArrayList.java:187)
    at java.util.ArrayList.add(ArrayList.java:411)
    at com.demo.test.HeapOOM.main(HeapOOM.java:12)
修改-Xmx为10m。其中的一次测试结果为,当count的值累加到540217时,发生OutOfMemoryError异常。随着-Xmx参数值的增大,java堆中可以存储的对象也越多。
2.PermGen space溢出: java.lang.OutOfMemoryError: PermGen space
PermGen space的全称是Permanent Generation space,是指内存的永久保存区域。为什么会内存溢出,这是由于这块内存主要是被JVM存放Class和Meta信息的,Class在被Load的时候被放入PermGen space区域,它和存放Instance的Heap区域不同,sun的 GC不会在主程序运行期对PermGen space进行清理,所以如果你的APP会载入很多CLASS的话,就很可能出现PermGen space溢出。一般发生在程序的启动阶段。
解决方法: 通过-XX:PermSize和-XX:MaxPermSize设置永久代大小即可。
方法区用于存放java类型的相关信息,如类名、访问修饰符、常量池、字段描述、方法描述等。在类装载器加载class文件到内存的过程中,虚拟机会提取其中的类型信息,并将这些信息存储到方法区。当需要存储类信息而方法区的内存占用又已经达到-XX:MaxPermSize设置的最大值,将会抛出OutOfMemoryError异常。对于这种情况的测试,基本的思路是运行时产生大量的类去填满方法区,直到溢出。这里需要借助CGLib直接操作字节码运行时,生成了大量的动态类。例子如下:
package com.demo.test;

import java.lang.reflect.Method;

import net.sf.cglib.proxy.Enhancer;
import net.sf.cglib.proxy.MethodProxy;
import net.sf.cglib.proxy.MethodInterceptor;

/**
 * VM Args: -XX:PermSize=10M -XX:MaxPermSize=10M
 */
public class MethodAreaOOM {

    public static void main(String[] args) {
        int count = 0;
        while (true) {
            Enhancer enhancer = new Enhancer();
            enhancer.setSuperclass(MethodAreaOOM.class);
            enhancer.setUseCache(false);
            enhancer.setCallback(new MethodInterceptor() {
                public Object intercept(Object obj, Method method, Object[] args, MethodProxy proxy) throws Throwable {
                    return proxy.invoke(obj, args);
                }
            });
            enhancer.create();
            System.out.println(++count);
        }
    }

}
-XX:MaxPermSize为10m。其中的一次测试结果为,当count的值累加到800时,发生如下异常:
Caused by: java.lang.OutOfMemoryError: PermGen space
    at java.lang.ClassLoader.defineClass1(Native Method)
    at java.lang.ClassLoader.defineClass(ClassLoader.java:792)
    ... 8 more
随着-XX:MaxPermSize参数值的增大,java方法区中可以存储的类型数据也越多。
3.栈溢出: java.lang.StackOverflowError : Thread Stack space
栈溢出了,JVM依然是采用栈式的虚拟机,这个和C和Pascal都是一样的。函数的调用过程都体现在堆栈和退栈上了。调用构造函数的 “层”太多了,以致于把栈区溢出了。 通常来讲,一般栈区远远小于堆区的,因为函数调用过程往往不会多于上千层,而即便每个函数调用需要 1K的空间(这个大约相当于在一个C函数内声明了256个int类型的变量),那么栈区也不过是需要1MB的空间。通常栈的大小是1-2MB的。通俗一点讲就是单线程的程序需要的内存太大了。 通常递归也不要递归的层次过多,很容易溢出。
解决方法:1:修改程序。2:通过 -Xss: 来设置每个线程的Stack大小即可。
在Java虚拟机规范中,对这个区域规定了两种异常状况:StackOverflowError和OutOfMemoryError异常。
(1)StackOverflowError异常
每当java程序代码启动一个新线程时,Java虚拟机都会为它分配一个Java栈。Java栈以帧为单位保存线程的运行状态。当线程调用java方法时,虚拟机压入一个新的栈帧到该线程的java栈中。只要这个方法还没有返回,它就一直存在。如果线程的方法嵌套调用层次太多(如递归调用),随着java栈中帧的逐渐增多,最终会由于该线程java栈中所有栈帧大小总和大于-Xss设置的值,而产生StackOverflowError内存溢出异常。例子如下:
package com.demo.test;

/**
 * VM Args: -Xss128k
 */
public class JavaVMStackSOF {

    private int count = 0;

    public static void main(String[] args) {
        new JavaVMStackSOF().method();
    }

    public void method() {
        System.out.println(++count);
        method();
    }


}
-Xss为128k。其中的一次测试结果为,当count的值累加到2230时,发生如下异常:
Exception in thread "main" java.lang.StackOverflowError
    at sun.nio.cs.UTF_8.updatePositions(UTF_8.java:77)
    at sun.nio.cs.UTF_8$Encoder.encodeArrayLoop(UTF_8.java:564)
    at sun.nio.cs.UTF_8$Encoder.encodeLoop(UTF_8.java:619)
    at java.nio.charset.CharsetEncoder.encode(CharsetEncoder.java:561)
    at sun.nio.cs.StreamEncoder.implWrite(StreamEncoder.java:271)
    at sun.nio.cs.StreamEncoder.write(StreamEncoder.java:125)
    at java.io.OutputStreamWriter.write(OutputStreamWriter.java:207)
    at java.io.BufferedWriter.flushBuffer(BufferedWriter.java:129)
    at java.io.PrintStream.write(PrintStream.java:526)
    at java.io.PrintStream.print(PrintStream.java:597)
    at java.io.PrintStream.println(PrintStream.java:736)
    at com.demo.test.JavaVMStackSOF.method(JavaVMStackSOF.java:15)
随着-Xss参数值的增大,可以嵌套的方法调用层次也相应增加。综上所述,StackOverflowError异常是由于方法调用的层次太深,最终导致为某个线程分配的所有栈帧大小总和大于-Xss设置的值,从而发生StackOverflowError异常。
(2)OutOfMemoryError异常
java程序代码启动一个新线程时,没有足够的内存空间为该线程分配java栈(一个线程java栈的大小由-Xss参数确定),jvm则抛出OutOfMemoryError异常。例子如下:
package com.demo.test;

/**
 * VM Args: -Xss128k
 */
public class JavaVMStackOOM {

    public static void main(String[] args) {
        int count = 0;
        while (true) {
            Thread thread = new Thread(new Runnable() {
                public void run() {
                    while (true) {
                        try {
                            Thread.sleep(5000);
                        } catch (Exception e) {
                        }
                    }
                }
            });
            thread.start();
            System.out.println(++count);
        }
    }

}
-Xss为128k。其中的一次测试结果为,当count的值累加到11958时,发生如下异常:
Exception in thread "main" java.lang.OutOfMemoryError: unable to create new native thread
    at java.lang.Thread.start0(Native Method)
    at java.lang.Thread.start(Thread.java:693)
    at com.demo.test.JavaVMStackOOM.main(JavaVMStackOOM.java:21)
随着-Xss参数值的增大,java程序可以创建的总线程数越少。
4.所以Server容器启动的时候我们经常关心和设置JVM的几个参数如下:
-Xms:java Heap初始大小, 默认是物理内存的1/64。
-Xmx:java Heap最大值,不可超过物理内存。
-Xmn:young generation的heap大小,一般设置为Xmx的3、4分之一 。增大年轻代后,将会减小年老代大小,可以根据监控合理设置。
-Xss:每个线程的Stack大小,而最佳值应该是128K,默认值好像是512k。
-XX:PermSize:设定内存的永久保存区初始大小,缺省值为64M。
-XX:MaxPermSize:设定内存的永久保存区最大大小,缺省值为64M。
-XX:SurvivorRatio:Eden区与Survivor区的大小比值,设置为8,则两个Survivor区与一个Eden区的比值为2:8,一个Survivor区占整个年轻代的1/10。
-XX:+UseParallelGC:F年轻代使用并发收集,而年老代仍旧使用串行收集。
-XX:+UseParNewGC:设置年轻代为并行收集,JDK5.0以上,JVM会根据系统配置自行设置,所无需再设置此值。
-XX:ParallelGCThreads:并行收集器的线程数,值最好配置与处理器数目相等 同样适用于CMS。
-XX:+UseParallelOldGC:年老代垃圾收集方式为并行收集(Parallel Compacting)。
-XX:MaxGCPauseMillis:每次年轻代垃圾回收的最长时间(最大暂停时间),如果无法满足此时间,JVM会自动调整年轻代大小,以满足此值。
-XX:+ScavengeBeforeFullGC:Full GC前调用YGC,默认是true。
实例如:JAVA_OPTS=”-Xms4g -Xmx4g -Xmn1024m -XX:PermSize=320M -XX:MaxPermSize=320m -XX:SurvivorRatio=6″
第一种OutOfMemoryError: PermGen space
发生这种问题的原意是程序中使用了大量的jar或class,使java虚拟机装载类的空间不够,与Permanent Generation space有关。解决这类问题有以下两种办法:
1、增加java虚拟机中的XX:PermSize和XX:MaxPermSize参数的大小,其中XX:PermSize是初始永久保存区域大 小,XX:MaxPermSize是最大永久保存区域大小。如针对tomcat6.0,在catalina.sh 或catalina.bat文件中一系列环境变量名说明结束处(大约在70行左右) 增加一行: JAVA_OPTS=" -XX:PermSize=64M -XX:MaxPermSize=128m" 如果是windows服务器还可以在系统环境变量中设置。感觉用tomcat发布sprint+struts+hibernate架构的程序时很容易发生这种内存溢出错误。使用上述方法,我成功解决了部署ssh项目的tomcat服务器经常宕机的问题。
2、清理应用程序中web-inf/lib下的jar,如果tomcat部署了多个应用,很多应用都使用了相同的jar,可以将共同的jar移到 tomcat共同的lib下,减少类的重复加载。这种方法是网上部分人推荐的,我没试过,但感觉减少不了太大的空间,最靠谱的还是第一种方法。
第二种OutOfMemoryError: Java heap space
发生这种问题的原因是java虚拟机创建的对象太多,在进行垃圾回收之间,虚拟机分配的到堆内存空间已经用满了,与Heap space有关。解决这类问题有两种思路:
1、检查程序,看是否有死循环或不必要地重复创建大量对象。找到原因后,修改程序和算法。 我以前写一个使用K-Means文本聚类算法对几万条文本记录(每条记录的特征向量大约10来个)进行文本聚类时,由于程序细节上有问题,就导致了 Java heap space的内存溢出问题,后来通过修改程序得到了解决。
2、增加Java虚拟机中Xms(初始堆大小)和Xmx(最大堆大小)参数的大小。如:set JAVA_OPTS= -Xms256m -Xmx1024m