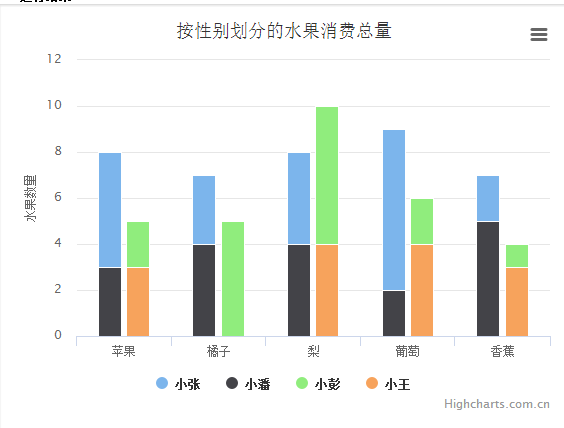
需求背景:highchart分组图表样式如下:
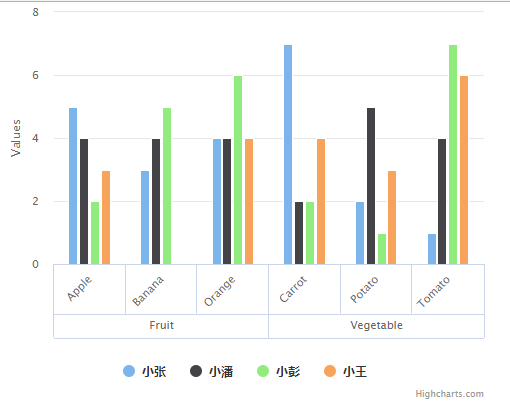
但是我需要的不是两个叠在一起的,在网上查了查,最终实现了效果如下:
参考代码:
1、HTML
<!DOCTYPE html>
<html lang="en">
<head>
    <meta charset="UTF-8">
    <script src='/front/common.js' type='text/javascript' charset='utf-8'></script>
    <title>Title</title>
</head>
<body>
<script src="../common/js/highcharts.js"></script>
<script src="grouped-categories.js"></script>
<script type="text/javascript">
    $(function () {
        var chart = new Highcharts.Chart({
            chart: {
                renderTo: "container",
                type: "column"
            },
            title: {
                text: null
            },
            series: [{
                name: '小张',
                data: [5, 3, 4, 7, 2, 1]
            }, {
                name: '小潘',
                data: [4, 4, 4, 2, 5, 4]
            }, {
                name: '小彭',
                data: [2, 5, 6, 2, 1, 7]
            }, {
                name: '小王',
                data: [3, 0, 4, 4, 3, 6]
            }],
            xAxis: {
                categories: [{
                    name: "Fruit",
                    categories: ["Apple", "Banana", "Orange"]
                }, {
                    name: "Vegetable",
                    categories: ["Carrot", "Potato", "Tomato"]
                }]
            }
        });
    });
</script>
<div id="container" style="height: 400px;  500px"></div>
</body>
</html>
2、grouped-categories.js
文件(http://blacklabel.github.io/grouped_categories/grouped-categories.js)
/* global Highcharts module window:true */ (function (factory) { if (typeof module === 'object' && module.exports) { module.exports = factory; } else { factory(Highcharts); } }(function (HC) { 'use strict'; /** * Grouped Categories v1.1.2 (2017-02-07) * * (c) 2012-2016 Black Label * * License: Creative Commons Attribution (CC) */ /* jshint expr:true, boss:true */ var UNDEFINED = void 0, mathRound = Math.round, mathMin = Math.min, mathMax = Math.max, merge = HC.merge, pick = HC.pick, each = HC.each, // #74, since Highcharts 4.1.10 HighchartsAdapter is only provided by the Highcharts Standalone Framework inArray = (window.HighchartsAdapter && window.HighchartsAdapter.inArray) || HC.inArray, // cache prototypes axisProto = HC.Axis.prototype, tickProto = HC.Tick.prototype, // cache original methods protoAxisInit = axisProto.init, protoAxisRender = axisProto.render, protoAxisSetCategories = axisProto.setCategories, protoTickGetLabelSize = tickProto.getLabelSize, protoTickAddLabel = tickProto.addLabel, protoTickDestroy = tickProto.destroy, protoTickRender = tickProto.render; function deepClone(thing) { return JSON.parse(JSON.stringify(thing)); } function Category(obj, parent) { this.userOptions = deepClone(obj); this.name = obj.name || obj; this.parent = parent; return this; } Category.prototype.toString = function () { var parts = [], cat = this; while (cat) { parts.push(cat.name); cat = cat.parent; } return parts.join(', '); }; // returns sum of an array function sum(arr) { var l = arr.length, x = 0; while (l--) { x += arr[l]; } return x; } // Adds category leaf to array function addLeaf(out, cat, parent) { out.unshift(new Category(cat, parent)); while (parent) { parent.leaves = parent.leaves ? (parent.leaves + 1) : 1; parent = parent.parent; } } // Builds reverse category tree function buildTree(cats, out, options, parent, depth) { var len = cats.length, cat; depth = depth ? depth : 0; options.depth = options.depth ? options.depth : 0; while (len--) { cat = cats[len]; if (cat.categories) { if (parent) { cat.parent = parent; } buildTree(cat.categories, out, options, cat, depth + 1); } else { addLeaf(out, cat, parent); } } options.depth = mathMax(options.depth, depth); } // Pushes part of grid to path function addGridPart(path, d, width) { // Based on crispLine from HC (#65) if (d[0] === d[2]) { d[0] = d[2] = mathRound(d[0]) - (width % 2 / 2); } if (d[1] === d[3]) { d[1] = d[3] = mathRound(d[1]) + (width % 2 / 2); } path.push( 'M', d[0], d[1], 'L', d[2], d[3] ); } // Returns tick position function tickPosition(tick, pos) { return tick.getPosition(tick.axis.horiz, pos, tick.axis.tickmarkOffset); } function walk(arr, key, fn) { var l = arr.length, children; while (l--) { children = arr[l][key]; if (children) { walk(children, key, fn); } fn(arr[l]); } } // // Axis prototype // axisProto.init = function (chart, options) { // default behaviour protoAxisInit.call(this, chart, options); if (typeof options === 'object' && options.categories) { this.setupGroups(options); } }; // setup required axis options axisProto.setupGroups = function (options) { var categories = deepClone(options.categories), reverseTree = [], stats = {}, labelOptions = this.options.labels, userAttr = labelOptions.groupedOptions, css = labelOptions.style; // build categories tree buildTree(categories, reverseTree, stats); // set axis properties this.categoriesTree = categories; this.categories = reverseTree; this.isGrouped = stats.depth !== 0; this.labelsDepth = stats.depth; this.labelsSizes = []; this.labelsGridPath = []; this.tickLength = options.tickLength || this.tickLength || null; // #66: tickWidth for x axis defaults to 1, for y to 0 this.tickWidth = pick(options.tickWidth, this.isXAxis ? 1 : 0); this.directionFactor = [-1, 1, 1, -1][this.side]; this.options.lineWidth = pick(options.lineWidth, 1); // #85: align labels vertically this.groupFontHeights = []; for (var i = 0; i <= stats.depth; i++) { var hasOptions = userAttr && userAttr[i - 1], mergedCSS = hasOptions && userAttr[i - 1].style ? merge(css, userAttr[i - 1].style) : css; this.groupFontHeights[i] = Math.round(this.chart.renderer.fontMetrics(mergedCSS ? mergedCSS.fontSize : 0).b * 0.3); } }; axisProto.render = function () { // clear grid path if (this.isGrouped) { this.labelsGridPath = []; } // cache original tick length if (this.originalTickLength === UNDEFINED) { this.originalTickLength = this.options.tickLength; } // use default tickLength for not-grouped axis // and generate grid on grouped axes, // use tiny number to force highcharts to hide tick this.options.tickLength = this.isGrouped ? 0.001 : this.originalTickLength; protoAxisRender.call(this); if (!this.isGrouped) { if (this.labelsGrid) { this.labelsGrid.attr({ visibility: 'hidden' }); } return false; } var axis = this, options = axis.options, top = axis.top, left = axis.left, right = left + axis.width, bottom = top + axis.height, visible = axis.hasVisibleSeries || axis.hasData, depth = axis.labelsDepth, grid = axis.labelsGrid, horiz = axis.horiz, d = axis.labelsGridPath, i = options.drawHorizontalBorders === false ? (depth + 1) : 0, offset = axis.opposite ? (horiz ? top : right) : (horiz ? bottom : left), tickWidth = axis.tickWidth, part; if (axis.userTickLength) { depth -= 1; } // render grid path for the first time if (!grid) { grid = axis.labelsGrid = axis.chart.renderer.path() .attr({ // #58: use tickWidth/tickColor instead of lineWidth/lineColor: strokeWidth: tickWidth, // < 4.0.3 'stroke-width': tickWidth, // 4.0.3+ #30 stroke: options.tickColor || '' // for styled mode (tickColor === undefined) }) .add(axis.axisGroup); // for styled mode - add class if (!options.tickColor) { grid.addClass('highcharts-tick'); } } // go through every level and draw horizontal grid line while (i <= depth) { offset += axis.groupSize(i); part = horiz ? [left, offset, right, offset] : [offset, top, offset, bottom]; addGridPart(d, part, tickWidth); i++; } // draw grid path grid.attr({ d: d, visibility: visible ? 'visible' : 'hidden' }); axis.labelGroup.attr({ visibility: visible ? 'visible' : 'hidden' }); walk(axis.categoriesTree, 'categories', function (group) { var tick = group.tick; if (!tick) { return false; } if (tick.startAt + tick.leaves - 1 < axis.min || tick.startAt > axis.max) { tick.label.hide(); tick.destroyed = 0; } else { tick.label.attr({ visibility: visible ? 'visible' : 'hidden' }); } return true; }); return true; }; axisProto.setCategories = function (newCategories, doRedraw) { if (this.categories) { this.cleanGroups(); } this.setupGroups({ categories: newCategories }); this.categories = this.userOptions.categories = newCategories; protoAxisSetCategories.call(this, this.categories, doRedraw); }; // cleans old categories axisProto.cleanGroups = function () { var ticks = this.ticks, n; for (n in ticks) { if (ticks[n].parent) { delete ticks[n].parent; } } walk(this.categoriesTree, 'categories', function (group) { var tick = group.tick; if (!tick) { return false; } tick.label.destroy(); each(tick, function (v, i) { delete tick[i]; }); delete group.tick; return true; }); this.labelsGrid = null; }; // keeps size of each categories level axisProto.groupSize = function (level, position) { var positions = this.labelsSizes, direction = this.directionFactor, groupedOptions = this.options.labels.groupedOptions ? this.options.labels.groupedOptions[level - 1] : false, userXY = 0; if (groupedOptions) { if (direction === -1) { userXY = groupedOptions.x ? groupedOptions.x : 0; } else { userXY = groupedOptions.y ? groupedOptions.y : 0; } } if (position !== UNDEFINED) { positions[level] = mathMax(positions[level] || 0, position + 10 + Math.abs(userXY)); } if (level === true) { return sum(positions) * direction; } else if (positions[level]) { return positions[level] * direction; } return 0; }; // // Tick prototype // // Override methods prototypes tickProto.addLabel = function () { var category; protoTickAddLabel.call(this); if (!this.axis.categories || !(category = this.axis.categories[this.pos])) { return false; } // set label text - but applied after formatter #46 if (this.label) { this.label.attr('text', this.axis.labelFormatter.call({ axis: this.axis, chart: this.axis.chart, isFirst: this.isFirst, isLast: this.isLast, value: category.name })); } // create elements for parent categories if (this.axis.isGrouped && this.axis.options.labels.enabled) { this.addGroupedLabels(category); } return true; }; // render ancestor label tickProto.addGroupedLabels = function (category) { var tick = this, axis = this.axis, chart = axis.chart, options = axis.options.labels, useHTML = options.useHTML, css = options.style, userAttr = options.groupedOptions, attr = { align: 'center', rotation: options.rotation, x: 0, y: 0 }, size = axis.horiz ? 'height' : 'width', depth = 0, label; while (tick) { if (depth > 0 && !category.tick) { // render label element this.value = category.name; var name = options.formatter ? options.formatter.call(this, category) : category.name, hasOptions = userAttr && userAttr[depth - 1], mergedAttrs = hasOptions ? merge(attr, userAttr[depth - 1]) : attr, mergedCSS = hasOptions && userAttr[depth - 1].style ? merge(css, userAttr[depth - 1].style) : css; // #63: style is passed in CSS and not as an attribute delete mergedAttrs.style; label = chart.renderer.text(name, 0, 0, useHTML) .attr(mergedAttrs) .css(mergedCSS) .add(axis.labelGroup); // tick properties tick.startAt = this.pos; tick.childCount = category.categories.length; tick.leaves = category.leaves; tick.visible = this.childCount; tick.label = label; tick.labelOffsets = { x: mergedAttrs.x, y: mergedAttrs.y }; // link tick with category category.tick = tick; } // set level size, #93 if (tick) { axis.groupSize(depth, tick.label.getBBox()[size]); } // go up to the parent category category = category.parent; if (category) { tick = tick.parent = category.tick || {}; } else { tick = null; } depth++; } }; // set labels position & render categories grid tickProto.render = function (index, old, opacity) { protoTickRender.call(this, index, old, opacity); var treeCat = this.axis.categories[this.pos]; if (!this.axis.isGrouped || !treeCat || this.pos > this.axis.max) { return; } var tick = this, group = tick, axis = tick.axis, tickPos = tick.pos, isFirst = tick.isFirst, max = axis.max, min = axis.min, horiz = axis.horiz, grid = axis.labelsGridPath, size = axis.groupSize(0), tickWidth = axis.tickWidth, xy = tickPosition(tick, tickPos), start = horiz ? xy.y : xy.x, baseLine = axis.chart.renderer.fontMetrics(axis.options.labels.style ? axis.options.labels.style.fontSize : 0).b, depth = 1, reverseCrisp = ((horiz && xy.x === axis.pos + axis.len) || (!horiz && xy.y === axis.pos)) ? -1 : 0, // adjust grid lines for edges gridAttrs, lvlSize, minPos, maxPos, attrs, bBox; // render grid for "normal" categories (first-level), render left grid line only for the first category if (isFirst) { gridAttrs = horiz ? [axis.left, xy.y, axis.left, xy.y + axis.groupSize(true)] : axis.isXAxis ? [xy.x, axis.top, xy.x + axis.groupSize(true), axis.top] : [xy.x, axis.top + axis.len, xy.x + axis.groupSize(true), axis.top + axis.len]; addGridPart(grid, gridAttrs, tickWidth); } if (horiz && axis.left < xy.x) { addGridPart(grid, [xy.x - reverseCrisp, xy.y, xy.x - reverseCrisp, xy.y + size], tickWidth); } else if (!horiz && axis.top <= xy.y) { addGridPart(grid, [xy.x, xy.y + reverseCrisp, xy.x + size, xy.y + reverseCrisp], tickWidth); } size = start + size; function fixOffset(tCat) { var ret = 0; if (isFirst) { ret = inArray(tCat.name, tCat.parent.categories); ret = ret < 0 ? 0 : ret; return ret; } return ret; } while (group.parent) { group = group.parent; var fix = fixOffset(treeCat), userX = group.labelOffsets.x, userY = group.labelOffsets.y; minPos = tickPosition(tick, mathMax(group.startAt - 1, min - 1)); maxPos = tickPosition(tick, mathMin(group.startAt + group.leaves - 1 - fix, max)); bBox = group.label.getBBox(true); lvlSize = axis.groupSize(depth); // check if on the edge to adjust reverseCrisp = ((horiz && maxPos.x === axis.pos + axis.len) || (!horiz && maxPos.y === axis.pos)) ? -1 : 0; attrs = horiz ? { x: (minPos.x + maxPos.x) / 2 + userX, y: size + axis.groupFontHeights[depth] + lvlSize / 2 + userY / 2 } : { x: size + lvlSize / 2 + userX, y: (minPos.y + maxPos.y - bBox.height) / 2 + baseLine + userY }; if (!isNaN(attrs.x) && !isNaN(attrs.y)) { group.label.attr(attrs); if (grid) { if (horiz && axis.left < maxPos.x) { addGridPart(grid, [maxPos.x - reverseCrisp, size, maxPos.x - reverseCrisp, size + lvlSize], tickWidth); } else if (!horiz && axis.top <= maxPos.y) { addGridPart(grid, [size, maxPos.y + reverseCrisp, size + lvlSize, maxPos.y + reverseCrisp], tickWidth); } } } size += lvlSize; depth++; } }; tickProto.destroy = function () { var group = this.parent; while (group) { group.destroyed = group.destroyed ? (group.destroyed + 1) : 1; group = group.parent; } protoTickDestroy.call(this); }; // return size of the label (height for horizontal, width for vertical axes) tickProto.getLabelSize = function () { if (this.axis.isGrouped === true) { // #72, getBBox might need recalculating when chart is tall var size = protoTickGetLabelSize.call(this) + 10, topLabelSize = this.axis.labelsSizes[0]; if (topLabelSize < size) { this.axis.labelsSizes[0] = size; } return sum(this.axis.labelsSizes); } return protoTickGetLabelSize.call(this); }; }));