import numpy as np
import  matplotlib.pyplot as plt

from sklearn.svm import LinearSVC
from sklearn.linear_model import Lasso
from sklearn.model_selection import train_test_split
from sklearn.feature_selection import SelectFromModel
from sklearn.datasets import load_digits,load_diabetes

#数据预处理嵌入式特征选择SelectFromModel模型
def test_SelectFromModel():
    digits=load_digits()
    X=digits.data
    y=digits.target
    estimator=LinearSVC(penalty='l1',dual=False)
    selector=SelectFromModel(estimator=estimator,threshold='mean')
    selector.fit(X,y)
    selector.transform(X)
    print("Threshold %s"%selector.threshold_)
    print("Support is %s"%selector.get_support(indices=True))

#调用test_SelectFromModel()
test_SelectFromModel()

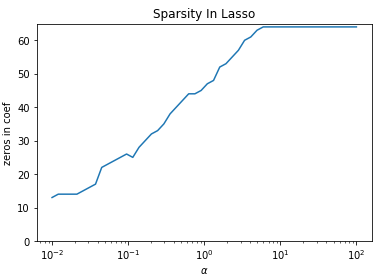
def load_diabetes():
    digits=load_digits()
    X=digits.data
    y=digits.target
    return X,y

def test_Lasso(*data):
    '''
    测试 alpha 与稀疏性的关系
    '''
    X,y=data
    alphas=np.logspace(-2,2)
    zeros=[]
    for alpha in alphas:
        regr=Lasso(alpha=alpha)
        regr.fit(X,y)
        ### 计算零的个数 ###
        num=0
        for ele in regr.coef_:
            if abs(ele) < 1e-5:num+=1
        zeros.append(num)
    ##### 绘图
    fig=plt.figure()
    ax=fig.add_subplot(1,1,1)
    ax.plot(alphas,zeros)
    ax.set_xlabel(r"$alpha$")
    ax.set_xscale("log")
    ax.set_ylim(0,X.shape[1]+1)
    ax.set_ylabel("zeros in coef")
    ax.set_title("Sparsity In Lasso")
    plt.show()

X,y = load_diabetes()
test_Lasso(X,y)
def test_LinearSVC(*data):
    '''
    测试 C  与 稀疏性的关系
    '''
    X,y=data
    Cs=np.logspace(-2,2)
    zeros=[]
    for C in Cs:
        clf=LinearSVC(C=C,penalty='l1',dual=False)
        clf.fit(X,y)
     ### 计算零的个数 ###
        num=0
        for row in clf.coef_:
            for ele in row:
                if abs(ele) < 1e-5:num+=1
        zeros.append(num)
    ##### 绘图
    fig=plt.figure()
    ax=fig.add_subplot(1,1,1)
    ax.plot(Cs,zeros)
    ax.set_xlabel("C")
    ax.set_xscale("log")
    ax.set_ylabel("zeros in coef")
    ax.set_title("Sparsity In SVM")
    plt.show()

X,y = load_diabetes()
test_LinearSVC(X,y)
