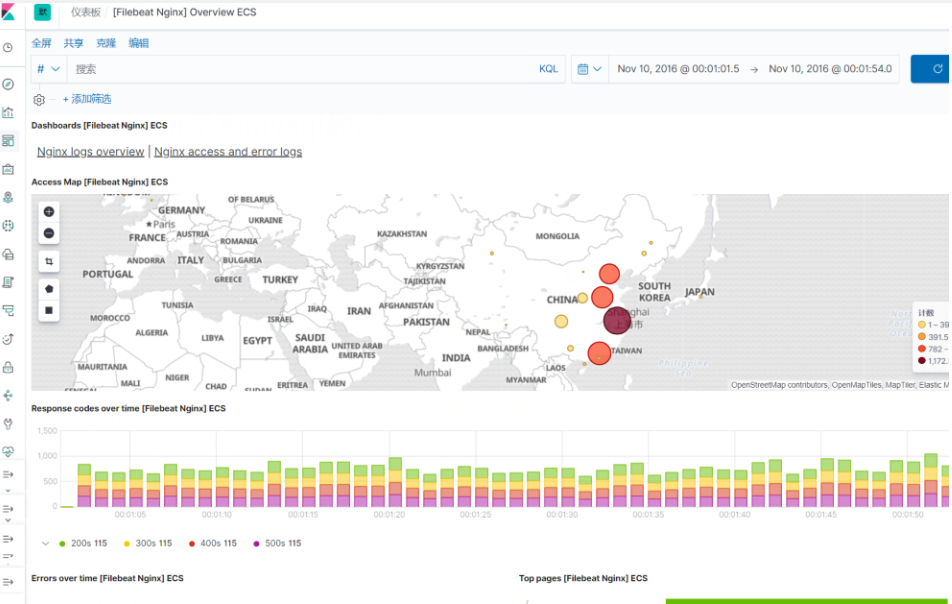
1、filebeat采集mysql的慢查询语句(借助之前的环境)
使用filebeat采集mysql的慢查询语句

1) 开启mysql慢日志以及错误日志
[root@web01 ~]# cat /etc/my.cnf
slow_query_log=ON
slow_query_log_file=/var/log/mariadb/slow.log
long_query_time=0.5
log-error=/var/log/mariadb/mariadb.log

2) 配置filebeat.yml
[root@web01 ~]# cat /etc/filebeat/filebeat.yml
filebeat.config.modules:
  path: ${path.config}/modules.d/*.yml
  reload.enabled: false
  #reload.period: 10s

setup.kibana:
  host: "10.0.0.161:5601"

output.elasticsearch:
  hosts: ["10.0.0.161:9200","10.0.0.162:9200","10.0.0.163:9200"]


3) 启动filebeat的module
[root@web01 ~]# filebeat modules enable mysql


4) 配置mysql module指向的日志路径
[root@web01 filebeat]# cat /etc/filebeat/modules.d/mysql.yml
# Module: mysql
# Docs: https://www.elastic.co/guide/en/beats/filebeat/7.4/filebeat-module-mysql.html

- module: mysql
  # Error logs
  error:
    enabled: true
    var.paths: ["/var/log/mariadb/mariadb.log"]

  # Slow logs
  slowlog:
    enabled: true
    var.paths: ["/var/log/mariadb/slow.log"]


5) 初始化环境
[root@web01 ~]# filebeat setup -e

6) 重载filebeat
[root@web01 ~]# systemctl restart filebeat
展示结果如下
2、Metricbeat--监控system

1.安装metricbeat
[root@web01 ~]# rpm -ivh metricbeat-7.4.0-x86_64.rpm

2.配置metricbeat
[root@web01 ~]# cat /etc/metricbeat/metricbeat.yml
metricbeat.config.modules:
  path: ${path.config}/modules.d/*.yml
  reload.enabled: false
  reload.period: 10s

setup.kibana:
  host: "10.0.0.161:5601"

output.elasticsearch:
  hosts: ["10.0.0.161:9200","10.0.0.162:9200","10.0.0.163:9200"]


3.默认metricbeat启用了system的监控,只需要对system模块采集的对象进行调整即可
[root@web01 ~]# cat /etc/metricbeat/modules.d/system.yml
# Module: system
# Docs: https://www.elastic.co/guide/en/beats/metricbeat/7.4/metricbeat-module-system.html

- module: system
  period: 10s
  metricsets:
    - cpu
    - load
    - memory
    - network
    - process
    - process_summary
    - socket_summary
    - entropy
    - core
    - diskio
    - socket
  process.include_top_n:
    by_cpu: 5      # include top 5 processes by CPU
    by_memory: 5   # include top 5 processes by memory

- module: system
  period: 1m
  metricsets:
    - filesystem
    - fsstat
  processors:
  - drop_event.when.regexp:
      system.filesystem.mount_point: '^/(sys|cgroup|proc|dev|etc|host|lib)($|/)'

- module: system
  period: 15m
  metricsets:
    - uptime

#- module: system
#  period: 5m
#  metricsets:
#    - raid
#  raid.mount_point: '/'


4.导入metricbeat相关的图形至kibana
[root@web01 ~]# metricbeat setup -e


5.启动metricbeat
[root@web01 ~]# systemctl enable metricbeat
[root@web01 ~]# systemctl start metricbeat
效果展示

metricbeat监控docker
1) 安装docker
[root@web01 ~]# yum install docker
[root@web01 ~]# systemctl start docker

2) 导入docker镜像
[root@web01 ~]# docker load -i docker_nginx1.15.tar.gz

3) 批量启动docker容器
for i in {1..100}
do
	docker run -d --name "nginx_$RANDOM"  nginx
done

4)启用metricbeat docker模块
[root@web01 ~]# metricbeat modules enable docker

5)配置docker metricset
[root@web01 ~]# cat /etc/metricbeat/modules.d/docker.yml
# Module: docker
# Docs: https://www.elastic.co/guide/en/beats/metricbeat/7.4/metricbeat-module-docker.html

- module: docker
  metricsets:
    - container
    - cpu
    - diskio
    - event
    - healthcheck
    - info
    - memory
    - network
  period: 10s
  hosts: ["unix:///var/run/docker.sock"]

6)重启metricbeat
[root@web01 ~]# systemctl restart metricbeat
metricbeat监控nginx
1)安装配置Nginx

[root@web01 ~]# yum install nginx -y
[root@web01 ~]# cat /etc/nginx/conf.d/bk.oldxu.com.conf
server {
	listen 80;
	server_name bk.oldxu.com;
	root /code/bk;

	location / {
		index index.html;
	}
	location /status {
		stub_status;
		allow 127.0.0.1;
		deny all;
	}
}
[root@web01 ~]# systemctl restart nginx
[root@web01 ~]# curl 127.0.0.1/status
Active connections: 1
server accepts handled requests
 1 1 1
Reading: 0 Writing: 1 Waiting: 0


2)启动meticbeat nginx模块
[root@web01 ~]# metricbeat modules enable nginx

3) 配置metriset
[root@web01 ~]# cat  /etc/metricbeat/modules.d/nginx.yml
# Module: nginx
# Docs: https://www.elastic.co/guide/en/beats/metricbeat/7.4/metricbeat-module-nginx.html

- module: nginx
  metricsets:
    - stubstatus
  period: 10s

  # Nginx hosts
  hosts: ["http://127.0.0.1"]
  server_status_path: "status"


4) 重启metricbeat
[root@web01 filebeat]# systemctl restart metricbeat
metricbeat监控redis
1)安装配置Redis
[root@web01 ~]# yum install redis -y
[root@web01 ~]# systemctl restart redis

2)启动meticbeat nginx模块
[root@web01 ~]# metricbeat modules enable redis

3) 配置metriset
[root@web01 ~]# cat /etc/metricbeat/modules.d/redis.yml
# Module: redis
# Docs: https://www.elastic.co/guide/en/beats/metricbeat/7.4/metricbeat-module-redis.html

- module: redis
  metricsets:
    - info
    - keyspace
  period: 10s

  # Redis hosts
  hosts: ["127.0.0.1:6379"]

  # Network type to be used for redis connection. Default: tcp
  network: tcp

  # Max number of concurrent connections. Default: 10
  maxconn: 10

  # Redis AUTH password. Empty by default.
  #password: foobared


4) 重启metricbeat
[root@web01 filebeat]# systemctl restart metricbeat
heartbeat监控
1.安装heartbeat
[root@web01 ~]# rpm -ivh heartbeat-7.4.0-x86_64.rpm


2.配置heartbeat
[root@web01 ~]# egrep -v "^#|^$" /etc/heartbeat/heartbeat.yml
heartbeat.config.monitors:
  path: ${path.config}/monitors.d/*.yml
  reload.enabled: false
  reload.period: 5s

heartbeat.monitors:
- type: http
  urls: ["http://10.0.0.161:9200","http://10.0.0.162:9200","http://10.0.0.163:9200"]
  schedule: '@every 10s'
  timeout: 16s

- type: tcp
  hosts: ["10.0.0.7"]
  schedule: '@every 10s'
  timeout: 16s
  ipv4: true
  ipv6: true
  mode: any
  ports: [80, 9200, 5044]


setup.kibana:
  host: "10.0.0.161:5601"

output.elasticsearch:
  hosts: ["10.0.0.161:9200","10.0.0.162:9200","10.0.0.163:9200"]

3.重启heartbeat
[root@web01 ~]# systemctl restart heartbeat-elastic.service
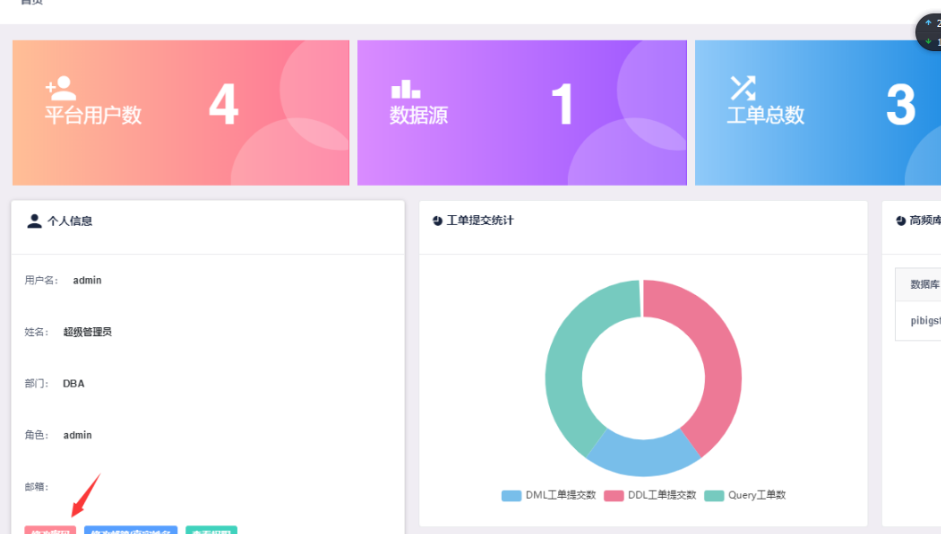
sql审计平台的搭建
[root@web01 ~]# yum install go -y
[root@web01 ~]# unzip Yearning-2.1.6.1.linux-amd64.zip
[root@web01 ~]# cd Yearning-go/
[root@web01 Yearning-go]# vim
conf.toml           docker-compose.yml  .DS_Store           Yearning
dist/               Dockerfile          # README
[root@web01 Yearning-go]# vim conf.toml
[root@web01 Yearning-go]# cat conf.toml
[Mysql]
Db = "Yearning"
Host = "127.0.0.1"
Port = "3306"
Password = "oldxu.com"
User = "root"

[General]
SecretKey = "dbcjqheupqjsuwsm"
[root@web01 Yearning-go]# mysql -uroot -poldxu.com
Welcome to the MariaDB monitor.  Commands end with ; or g.
Your MariaDB connection id is 12
Server version: 5.5.64-MariaDB MariaDB Server

Copyright (c) 2000, 2018, Oracle, MariaDB Corporation Ab and others.

Type 'help;' or 'h' for help. Type 'c' to clear the current input statement.

MariaDB [(none)]> create database Yearning -utf8;
Query OK, 1 row affected (0.00 sec)

MariaDB [(none)]> Bye
[root@web01 Yearning-go]# ./Yearning -S start

默认账号密码:admin
           :Yearning_admin