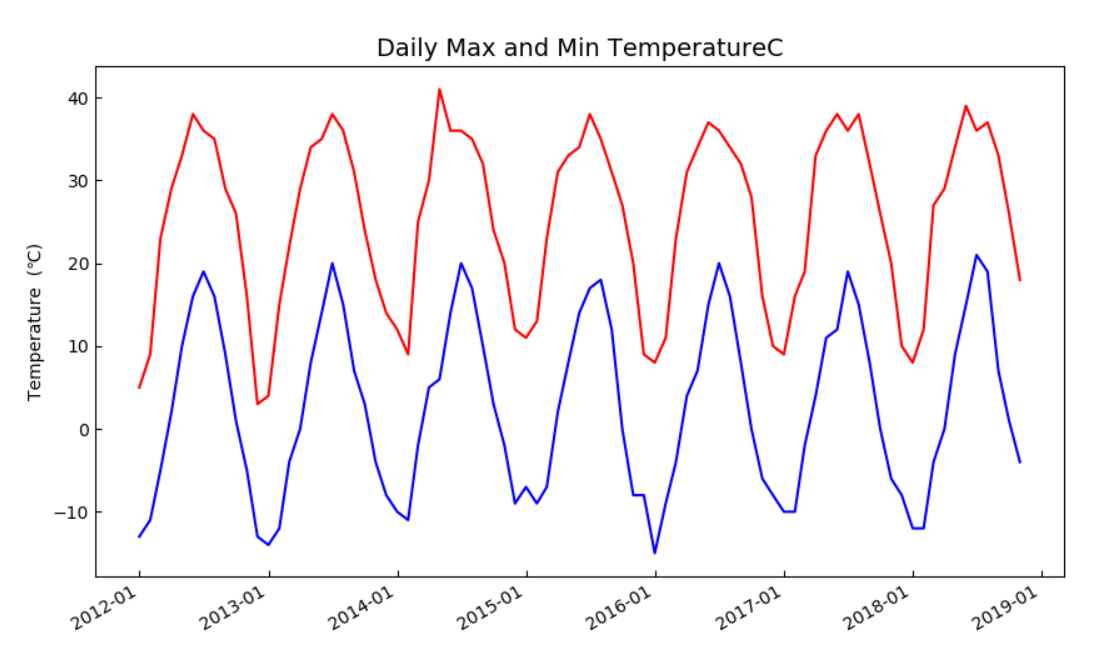
天气数据可以从网上下载,这个例子的数据是从http://data.cma.cn/下载而来的。
下载的数据装在txt文件中。

里面包含了12年开始北京的月最低和最高温度。
读取数据:
1 with open('S201812261702093585500.txt') as file_object:
2     lines=file_object.readlines()
将txt中的数据逐行存到列表lines里 lines的每一个元素对应于txt中的一行。然后将每个元素中的不同信息提取出来:
1 file1=[]
2 row=[]
3 for line in lines:
4     row=line.split() #指定空格作为分隔符对line进行切片
5     file1.append(row)
这样,所有的信息都存在了中file1中,file1嵌套了列表row,file1中的每一元素包含了一个列表,所有的信息都被分隔开了。
可以print(file1)看一下:

需要使用第2、3、4、5列的年、月、最低温度、最高温度信息,将它们分别提取出来。
 1 date=[]
 2 highs=[]
 3 lows=[]
 4 for row1 in file1:
 5     a=row1[1]+"-"+row1[2] #合并年月
 6     date.append(a) 7 for row1 in file1:
 8     lows.append(row1[3])
 9     highs.append(row1[4])
在读数据时将表头也读进去了,删除列表第一个元素
1 del highs[0]
2 del lows[0]
3 del date[0]
现在,日期和温度数据被分别存在date、highs、lows三个列表里,但是还不能直接使用,因为提取出来的都是字符型数据,转换数据格式为int型:
1 int_highs=[]
2 for str_h in highs:
3     a=int(float(str_h))
4     int_highs.append(a)
5
6 int_lows=[]
7 for str_l in lows:
8     a=int(float(str_l))
9     int_lows.append(a)
将日期转换为日期格式,需要使用datetime模块,在文件开头加上from datetime import datetime,:
1 from datetime import datetime
2 dates=[]
3 for a in date:
4     current_dates=datetime.strptime(a,'%Y-%m')
5     dates.append(current_dates)
导入matplotlib模块
1 from matplotlib import pyplot as plt
2 import matplotlib.dates as mdates
下面就准备画图啦:
 1 fig=plt.figure(figsize=(10,6))
 2 ax1=fig.add_subplot(111) # 将画面分割为1行1列选第一个
 3 ax1.xaxis.set_major_formatter(mdates.DateFormatter('%Y-%m'))#设置横轴为日期格式
 4 ax1.plot(dates,int_highs,c="red")#画最高温度,颜色红
 5 ax1.plot(dates,int_lows,c="blue")#画最低温度,颜色蓝
 6 fig.autofmt_xdate()
 7 ax1.set_title("Daily Max and Min TemperatureC",fontsize=14)#标题
 8 ax1.set_ylabel("Temperature  (℃)")#纵轴label
 9 ax1.tick_params(direction='in')#刻度向里
10 plt.show()
画好的图:
