作者:桂。
时间:2017-03-10 22:13:36
链接:http://www.cnblogs.com/xingshansi/p/6533579.html
声明:欢迎转载,不过记得注明出处哦~

前言
|
本文作为:曲线拟合与分布拟合 一文的补充内容,主要介绍MATLAB直方图的绘制,以及对应归一化直方图的实现。全文分三部分简单介绍: 1)直方图(hist)绘制; 2)栅栏图(bar)绘制; 3)归一化直方图实现。 |
一、直方图(hist)
可以对hist的直方图进行限定,两种途径:个数模式(nbins)/区间模式(numter)
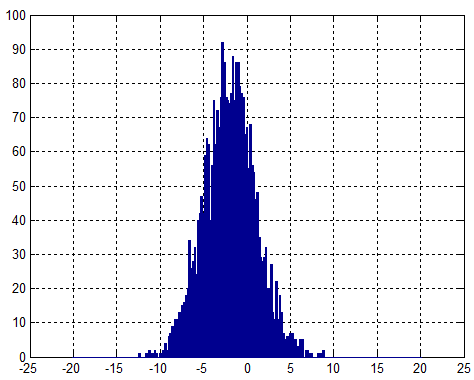
A-个数模式
nbins:指定直方图区间个数。
给出代码:
rng('default') % for reproducibility
x = 3*randn(3000,1)-2;
nbins = 50;
hist(x, nbins);
grid on;
结果图:
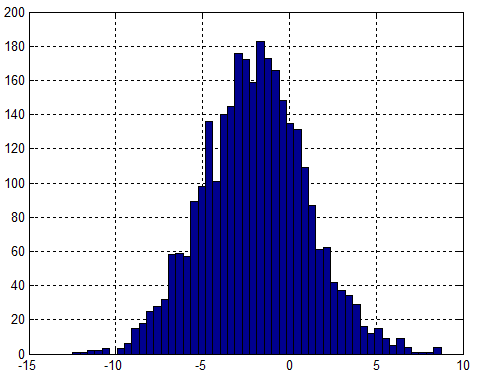
B-区间模式
numter:[start:interval:end].
给出代码:
rng('default') % for reproducibility
x = 3*randn(3000,1)-2;
numter = [-20:.2:20];
hist(x, numter);
grid on;
对应结果图:
此外,hist的输出结果有两个(三种方式均可):
[histFreq, histXout]=hist(x);
[histFreq, histXout]=hist(x, nbins);
[histFreq, histXout]=hist(x, numter);
给出一个演示代码:
rng('default') % for reproducibility
x = 3*randn(3000,1)-2;
nbins = 50;
[histFreq, histXout]=hist(x, nbins);
subplot 311
hist(x,nbins);grid on;
subplot 312
plot(histXout,histFreq,'r','linewidth',2);
grid on;

subplot 313
hist(x,nbins);hold on;
plot(histXout,histFreq,'r','linewidth',2);
grid on;
对应结果图:
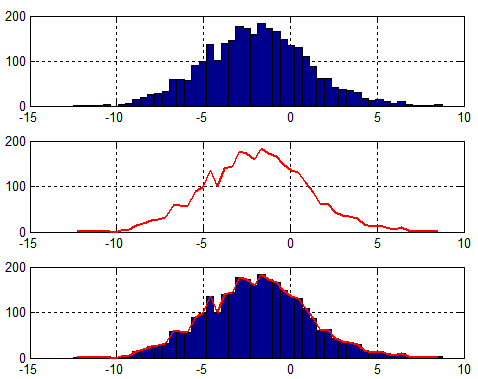
可以看到,对于结果:[histFreq, histXout] —>histXout:横坐标;histFreq:纵坐标。
二、栅栏图(bar)
关于bar,只提及一点,给出代码:
x = 1900:10:2000;
y = [75.995,91.972,105.711,123.203,131.669,...
     150.697,179.323,203.212,226.505,249.633,281.422];
figure;
subplot 211
bar(y);grid on;
subplot 212
bar(x,y);grid on;
结果图:
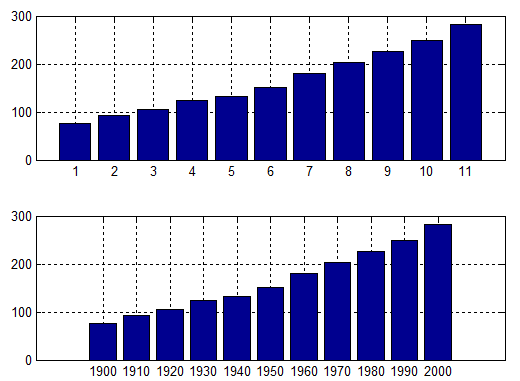
即bar可以指定横轴坐标以及纵轴坐标。
三、归一化直方图
借助hist的输出,以及bar的特性,我们可以生成归一化直方图,思路:
- 步骤一:求解每一个bin的区间宽度:binWidth = histXout(2)-histXout(1);
- 步骤二:求解所有bin的面积:binWidth/sum(histFreq)
- 步骤三:求解面积归一化后的高度(宽度保持不变):histFreq/binWidth/sum(histFreq)
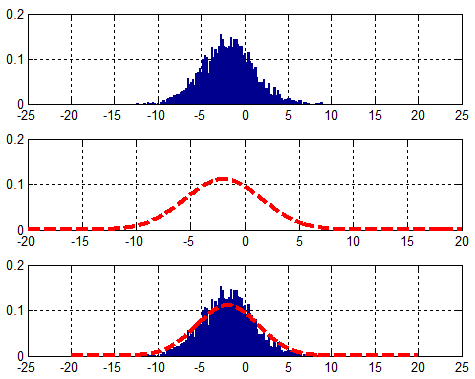
直方图归一化的代码:
rng('default') % for reproducibility
x = 3*randn(3000,1)-2;
numOfBins = 100;
% [histFreq, histXout] = hist(x, numOfBins);
numter = [-20:.2:20];
[histFreq, histXout] = hist(x, numter);
binWidth = histXout(2)-histXout(1);
%Bar
figure;
subplot 311
bar(histXout, histFreq/binWidth/sum(histFreq)); hold on;grid on;
这样一来,我们对分布拟合,便可以更直观地观察直方图分布与拟合结果的关系: