作者:桂。
时间:2017-05-06 11:20:47
链接:http://www.cnblogs.com/xingshansi/p/6816308.html

前言
本文主要记录librosa工具包的使用,librosa在音频、乐音信号的分析中经常用到,是python的一个工具包,这里主要记录它的相关内容以及安装步骤,用的是python3.5以及win8.1环境。
一、MIR简介
音乐信息检索(Music information retrieval,MIR)主要翻译自wikipedia.
MIR是从音乐中检索信息的跨学科科学,该领域需要心理学、乐理学、信号处理、机器学习等学科的背景知识。
目前MIR的商业应用主要包括:
- 推荐系统
目前音乐推荐的应用很多,但很少是基于MIR技术实现的,现在主流技术是通过人工标记或者用户的评论以及收听历史等简介数据进行分类判断,进而实现推荐,但事实上不同音乐本身的相似性是很多的- 轨道分离及乐器识别
实现音乐的轨道分离,以及从音乐中识别出是何种乐器在演奏- 自动录音
根据音乐自动转换成MIDI文件或者乐谱- 音乐分类
根据音乐的产地、艺术家身份、音乐节奏等特征,借助机器学习方法进行音乐分类- 自动生成音乐
利用数据库训练模式,让机器自主创造音乐MIR领域涉及到的知识包括:
- 语料库:没有音乐库,利用机器学习挖掘历史出统计规律,是不够现实的
- 特征提取:例如常见的MFCC,是音色的一种度量,另外和弦、和声、节奏等音乐的特性,都需要合适的特征来进行表征
- 统计学习方法以及机器学习的相关知识
MIR用到的相关工具包可以参考isMIR主页。
二、Librosa功能简介
librosa对于MIR来讲就是特征提取的工具,当然一般音频分析也可以借用librosa。
A-主要功能
更多细节可以参考其主页。
- 音频处理
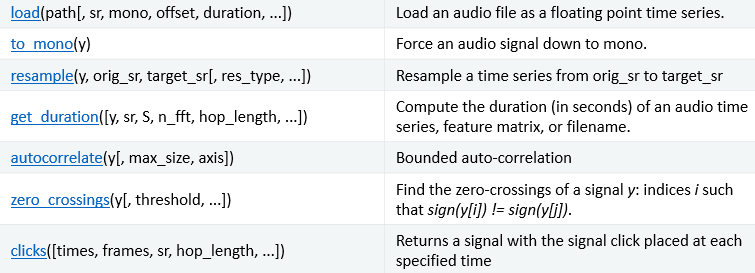
load:读取文件,可以是wav、mp3等格式;resample:重采样;get_duration:计算音频时长;autocorrelate:自相关函数;zero crossings:过零率;
- 频谱特性
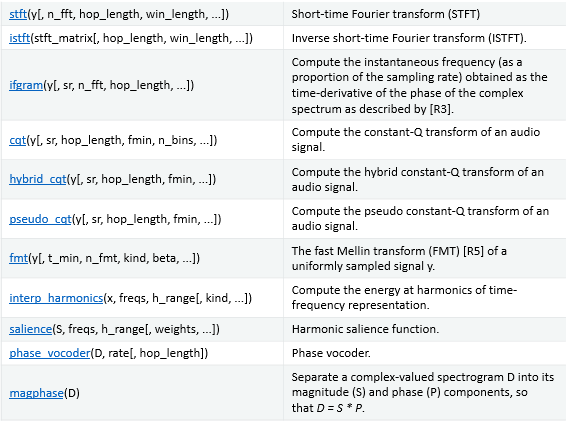
stft:短时傅里叶变换;istft:逆短时傅里叶变换;ifgram:瞬时频率;cqt:音乐中常用的CQT算法(constant-Q transform);hybrid cqt:混合CQT变换;fmt:快速梅林变换;interp harmonics:主要计算时频信号中谐波的能量;salience:谐波显示功能;phase vocoder:相位声码;magphase:相位幅值
- 幅度
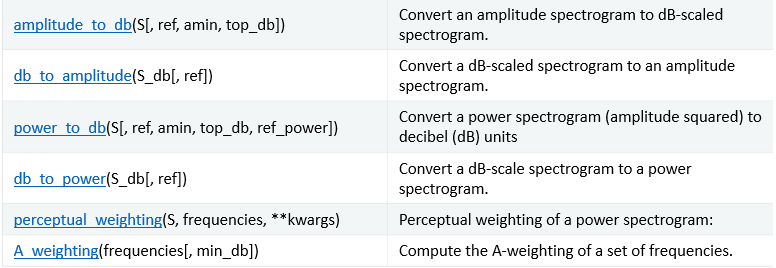
就是一些数值不同度量的转化。
- 时频转化
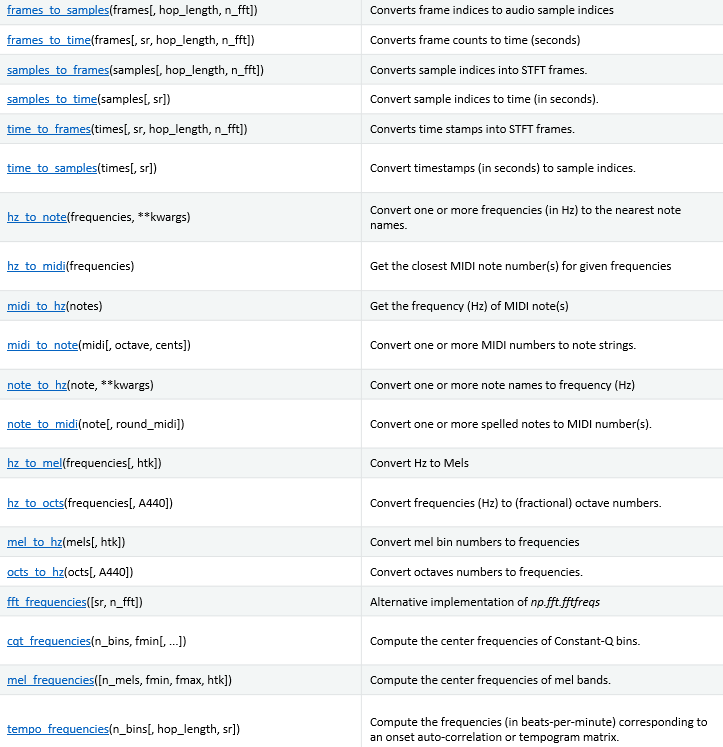
这个比较直观,就不啰嗦了。
- Pitch and tuning(音调和曲调?清楚的麻烦说一下二者具体区别)

- Dynamic Time Warping
就是DWT,动态时间规整。

以上只是一部分,其他的功能还有很多:
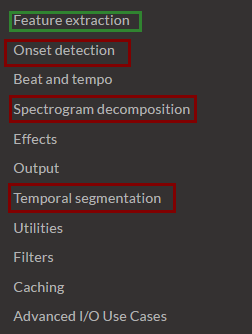
例如常用的MFCC提取就是Feature extraction中的一个函数而已。
B-常用功能
比如读取一个音频信号:
import librosa
# 1. Get the file path to the included audio example
filepath = 'C:\Users\Nobleding\Documents\FileRecv\'
filename =filepath+'bluesky.wav'
# 2. Load the audio as a waveform `y`
#    Store the sampling rate as `sr`
y, sr = librosa.load(filename,sr=None)
load默认的采样率是22050,如果需要读取原始采样率,需要.load(filename,sr=None)而不是load(filename)
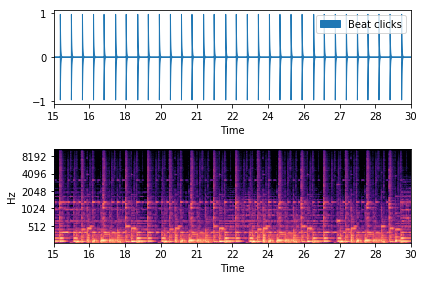
例如读取一段音频,判断节奏,并画出时频特性:
# Beat tracking example
#from __future__ import print_function
import librosa
import matplotlib.pyplot as plt
import librosa.display

# 1. Get the file path to the included audio example
# Sonify detected beat events
y, sr = librosa.load(librosa.util.example_audio_file())
tempo, beats = librosa.beat.beat_track(y=y, sr=sr)
y_beats = librosa.clicks(frames=beats, sr=sr)

# Or generate a signal of the same length as y
y_beats = librosa.clicks(frames=beats, sr=sr, length=len(y))

# Or use timing instead of frame indices
times = librosa.frames_to_time(beats, sr=sr)
y_beat_times = librosa.clicks(times=times, sr=sr)

# Or with a click frequency of 880Hz and a 500ms sample
y_beat_times880 = librosa.clicks(times=times, sr=sr,
                                 click_freq=880, click_duration=0.5)

# Display click waveform next to the spectrogram
plt.figure()
S = librosa.feature.melspectrogram(y=y, sr=sr)
ax = plt.subplot(2,1,2)
librosa.display.specshow(librosa.power_to_db(S, ref=np.max),
                         x_axis='time', y_axis='mel')
plt.subplot(2,1,1, sharex=ax)
librosa.display.waveplot(y_beat_times, sr=sr, label='Beat clicks')
plt.legend()
plt.xlim(15, 30)
plt.tight_layout()
关于可视化多说两句,librosa.display模块并不默认包含在librosa中,所以开头两句都要有:
import librosa
import librosa.display
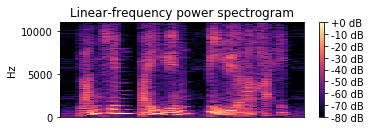
例如这个时候想显示语谱图:
import librosa
import matplotlib.pyplot as plt
import numpy as np
import librosa.display

# 1. Get the file path to the included audio example
filepath = 'C:\Users\Nobleding\Documents\FileRecv\'
filename =filepath+'bluesky1.wav'
# 2. Load the audio as a waveform `y`
#    Store the sampling rate as `sr`
y, sr = librosa.load(filename,sr=None)

plt.figure(figsize=(12, 8))
D = librosa.amplitude_to_db(librosa.stft(y), ref=np.max)
plt.subplot(4, 2, 1)
librosa.display.specshow(D, y_axis='linear')
plt.colorbar(format='%+2.0f dB')
plt.title('Linear-frequency power spectrogram')
例如想观察CQT变换:
CQT = librosa.amplitude_to_db(librosa.cqt(y, sr=16000), ref=np.max)
plt.subplot(4, 2, 3)
librosa.display.specshow(CQT, y_axis='cqt_note')
plt.colorbar(format='%+2.0f dB')
plt.title('Constant-Q power spectrogram (note)')
其他以此类推。

MFCC提取:
import librosa
import librosa.display

# 1. Get the file path to the included audio example
# Sonify detected beat events
y, sr = librosa.load(librosa.util.example_audio_file())
librosa.feature.mfcc(y=y, sr=sr)
librosa在youtube上有简要的教程。
三、librosa的安装
libsora对应的链接点击这里。安装报错两个:
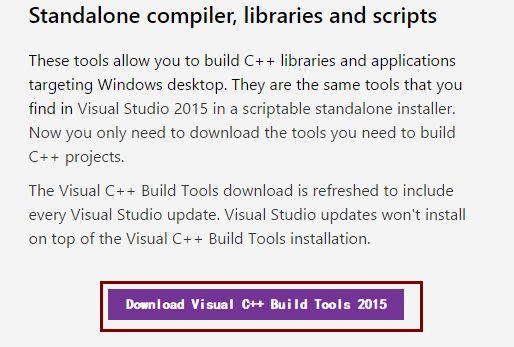
关于microsoft visual c++ 14.0 :

解决思路是:
- Download Microsoft Visual C++ Build Tools 2015
- Install this, making sure in the install options to select the “Windows SDK” appropriate for your version of Windows. Windows 7 systems should use Windows 8.1 SDK.
找到visual C++下载页面,点击这里:
安装完成后,安装resampy。
关于resampy(同样依赖microsoft visual c++ 14.0):
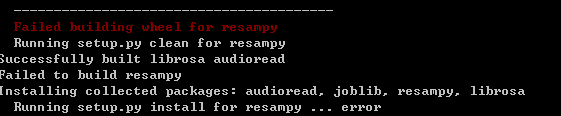
resampy是采样率转化工具,github关于resampy的安装包点击这里。
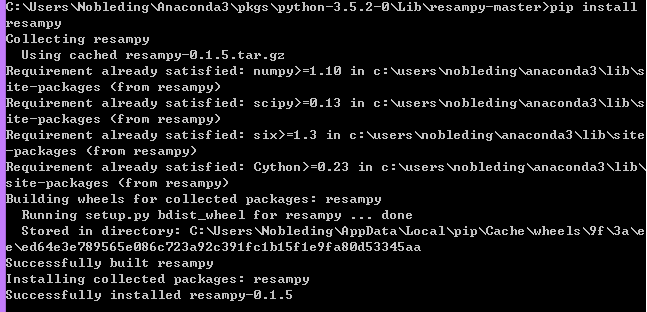
cd到对应文件夹,我放在了pkgslib文件夹内,输入:
pip install resampy
可以看到resampy已经成功安装:
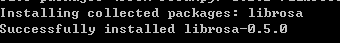
进一步安装librosa,同样放在pkgslib文件夹内,cd到对应目录,输入:
pip install librosa
即可完成librosa的安装。
参考: