转自:http://blog.sina.com.cn/s/blog_7db803c10102weyk.html
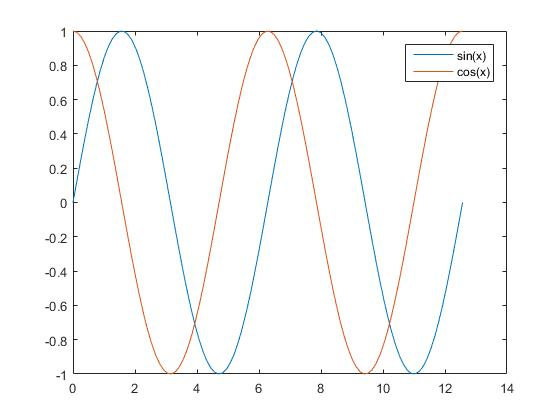
Matlab中legend默认的位置在NorthEast,如图所示:
%Matlab中legend的位置设置

clc
clear
close all
Npoint = 100;
x = linspace(0,4*pi,Npoint);
y1 = sin(x);
y2 = cos(x);
H = plot(x,y1,x,y2);
legend('sin(x)','cos(x)');
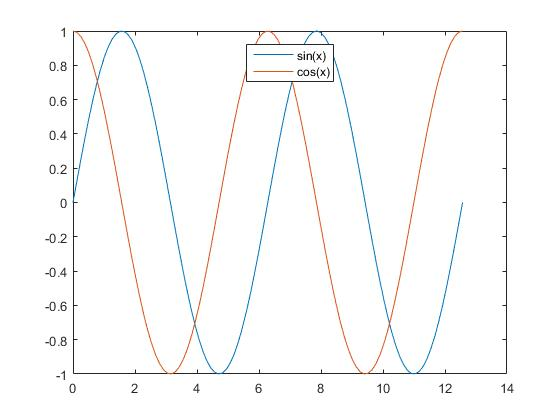
然而,我们却可以通过Location对legend的位置进行改变,变为North,如图所示
%Matlab中legend的位置设置

clc
clear
close all
Npoint = 100;
x = linspace(0,4*pi,Npoint);
y1 = sin(x);
y2 = cos(x);
H = plot(x,y1,x,y2);
legend('sin(x)','cos(x)','Location','North');
Matlab位置选择
| 设置 | 位置 |
|---|---|
| 'North' | inside plot box near top |
| 'South' | inside bottom |
| 'East' | inside right |
| 'West' | inside left |
| 'NorthEast' | inside top right (default for 2-D plots) |
| 'NorthWest' | inside top left |
| 'SouthEast' | inside bottom right |
| 'SouthWest' | inside bottom left |
| 'NorthOutside' | outside plot box near top |
| 'SouthOutside' | outside bottom |
| 'EastOutside' | outside right |
| 'WestOutside' | outside left |
| 'NorthEastOutside' | outside top right (default for 3-D plots) |
| 'NorthWestOutside' | outside top left |
| 'SouthEastOutside' | outside bottom right |
| 'SouthWestOutside' | outside bottom left |
| 'Best' | least conflict with data in plot |
| 'BestOutside' | least unused space outside plot |
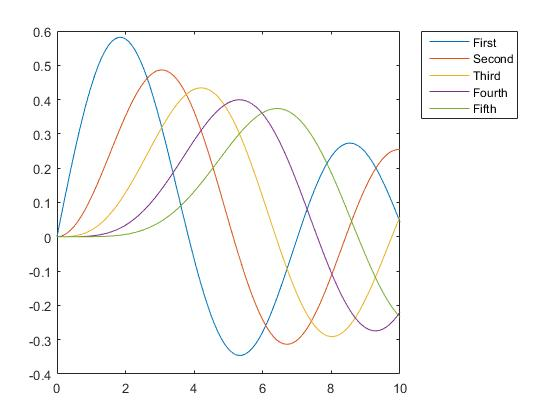
Matlab中还可以选择某条曲线legend的指定显示
%Matlab中legend的选择

clc
clear
close all
Npoint = 101;
x = linspace(0,10,Npoint);
y1 = besselj(1,x);
y2 = besselj(2,x);
y3 = besselj(3,x);
y4 = besselj(4,x);
y5 = besselj(5,x);
H = plot(x,y1,x,y2,x,y3,x,y4,x,y5);
legend('First','Second','Third','Fourth','Fifth','Location','NorthEastOutside')
如果只想显示第1、3、5条,也很简单
%Matlab中legend的选择

clc
clear
close all
Npoint = 101;
x = linspace(0,10,Npoint);
y1 = besselj(1,x);
y2 = besselj(2,x);
y3 = besselj(3,x);
y4 = besselj(4,x);
y5 = besselj(5,x);
H = plot(x,y1,x,y2,x,y3,x,y4,x,y5);
h1 = legend(H([1 3 5]),'First','Third','Fifthth','Location','NorthEastOutside')
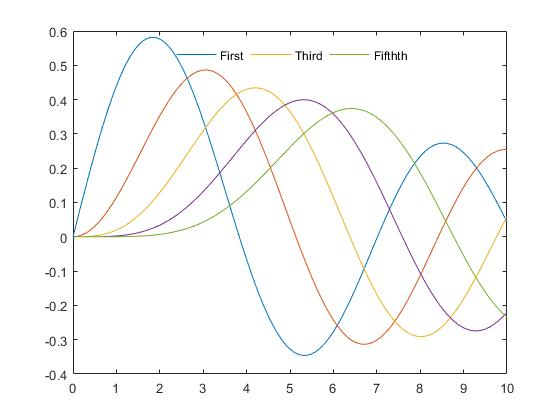
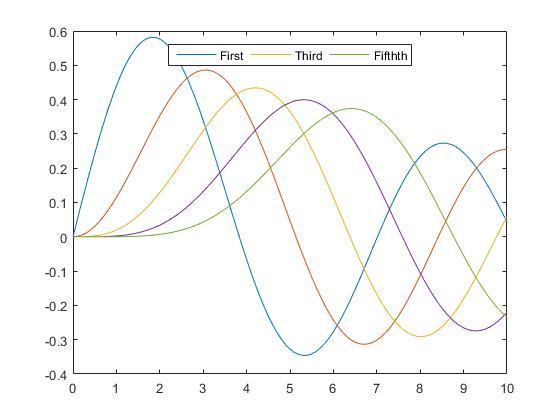
还可以使用Orientation对legend进行横向排列
%Matlab中legend的横排,注意,Location位置改变为North

clc
clear
close all
Npoint = 101;
x = linspace(0,10,Npoint);
y1 = besselj(1,x);
y2 = besselj(2,x);
y3 = besselj(3,x);
y4 = besselj(4,x);
y5 = besselj(5,x);
H = plot(x,y1,x,y2,x,y3,x,y4,x,y5);
h1 = legend(H([1 3 5]),'First','Third','Fifthth','Location','North');
set(h1,'Orientation','horizon')
不显示方框:
clc
clear
close all
Npoint = 101;
x = linspace(0,10,Npoint);
y1 = besselj(1,x);
y2 = besselj(2,x);
y3 = besselj(3,x);
y4 = besselj(4,x);
y5 = besselj(5,x);
H = plot(x,y1,x,y2,x,y3,x,y4,x,y5);
h1 = legend(H([1 3 5]),'First','Third','Fifthth','Location','North');
set(h1,'Orientation','horizon','Box','off')