一. ELK 分布式日志实战介绍
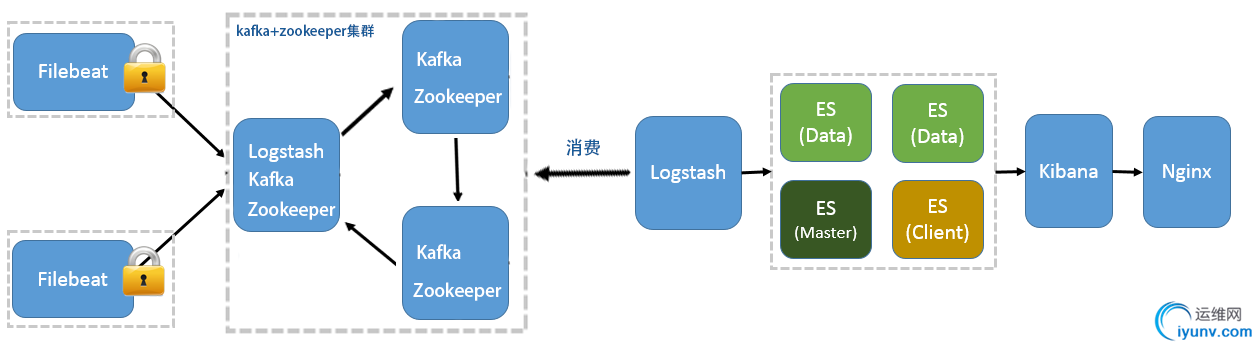
此实战方案以 Elk 6.4.0版本为准,分布式日志将以下图分布进行安装部署以及配置。
当Elk需监控应用日志时,需在应用部署所在的服务器中,安装Filebeat日志采集工具,日志采集工具通过配置,采集本地日志文件,将日志消息传输到Kafka集群,
我们可部署日志中间服务器,安装Logstash日志采集工具,Logstash直接消费Kafka的日志消息,并将日志数据推送到Elasticsearch中,并且通过Kibana对日志数据进行展示。
二、ELK安装部署开始
大家安装部署之前,可先参考官方文档进行部署。(官方参考文档地址可点击一下超链接)
注:Elasticsearch 6.4.0 默认安装了x-pack 安全插件,该插件授权 30天试用。(如过期,则自行选择购买,或者破解,本方案不提供破解方案)
Elasticsearch 6.4.0 Kibana 6.4.0 Logstash 6.4.0 Filebeat 6.4.0
1、安装 Elasticsearch
1.1、下载安装Elasticsearch 6.4.0
wget https://artifacts.elastic.co/downloads/elasticsearch/elasticsearch-6.4.0.tar.gz
wget https://artifacts.elastic.co/downloads/elasticsearch/elasticsearch-6.4.0.tar.gz.sha512

# 当shasum命令不存在时,可执行命令安装 yum install perl-Digest-SHA
shasum -a 512 -c elasticsearch-6.4.0.tar.gz.sha512
tar -xzf elasticsearch-6.4.0.tar.gz
cd elasticsearch-6.4.0/
2.1、配置Elasticsearch 集群
2.1.1 配置服务器hosts
由于模拟生产环境,提升计算能力,跨主机集群配置为优选
#1.配置集群之前先配置每台节点主机hosts,下图以测试环境为例:
配置 es-node1 和 es-node2 两台主机名称, es-node1为本机主机 ,如若增加主机节点,可配置es-node3 …,elasticsearch可配置上千节点作为集群服务节点
vi /etc/hosts

10.240.37.56  es-node1
10.240.37.57  es-node2
10.240.37.58  es-node3
2.1.2 配置Elasticsearch
A.配置es-node1节点集群配置,如下配置 node.master:true 表示为主节点,node.data:true 表示主节点也作为数据节点
[root@10-240-37-56 elasticsearch-6.4.0]# grep ^[a-z] config/elasticsearch.yml
cluster.name: my_es_cluster
node.name: es-node1
path.data: /data/elk/data/
path.logs: /data/elk/logs
network.host: 0.0.0.0
http.port: 9200
transport.tcp.port: 9300
discovery.zen.ping.unicast.hosts: ["10.240.37.56", "10.240.37.57"]
http.cors.enabled: true
http.cors.allow-origin: "*"
node.master: true
node.data: true
B.配置es-node2节点集群配置
[root@10-240-37-57 elasticsearch-6.4.0]# grep ^[a-z] config/elasticsearch.yml
cluster.name: my_es_cluster
node.name: es-node2
path.data: /data/elk/data
path.logs: /data/elk/logs
network.host: 0.0.0.0
transport.tcp.port: 9300
transport.tcp.compress: true
http.port: 9200
discovery.zen.ping.unicast.hosts: ["10.240.37.56", "10.240.37.57"]
http.cors.enabled: true
http.cors.allow-origin: "*"
node.master: false
node.data: true
C.配置es-node3节点集群配置
[root@10-240-37-58 elasticsearch-6.4.0]# grep ^[a-z] config/elasticsearch.yml
cluster.name: my_es_cluster
node.name: es-node3
path.data: /data/elk/data
path.logs: /data/elk/logs
network.host: 0.0.0.0
transport.tcp.port: 9300
transport.tcp.compress: true
http.port: 9200
discovery.zen.ping.unicast.hosts: ["10.240.37.56", "10.240.37.57","10.240.37.58"]
http.cors.enabled: true
http.cors.allow-origin: "*"
node.master: false
node.data: true
2.1.3 启动elasticsearch
A.启动elasticsearch服务之前,需先配置es用户组和es用户(由于es安全因素)
[root@10-240-37-58 app]# groupadd es #增加es组
[root@10-240-37-58 app]# useradd es -g es -p pwd  #增加es用户并附加到es组
[root@10-240-37-58 app]# chown -R es:es elasticsearch-6.4.0   #分配es目录访问权限
[root@10-240-37-58 app]#chown -R es:es /data/elk/
[root@10-240-37-58 app]# su es   #切换es用户
[es@10-240-37-58 app]$ ./elasticsearch-6.4.0/bin/elasticsearch &    启动命令
C.第一次启动将遇到问题
ERROR: [2] bootstrap checks failed
[1]: max file descriptors [4096] for elasticsearch process is too low, increase to at least [65536]
#切换到root用户修改
vi /etc/security/limits.conf

#在最后面追加
es hard nofile 65536
es soft nofile 65536

#修改后重新登录es账号,使用命令查看上面设置是否成功,结果为65536则成功
ulimit -Hn
[2]: max virtual memory areas vm.max_map_count [65530] is too low, increase to at least [262144]
#切换到root用户
vi /etc/sysctl.conf

#在最后追加
vm.max_map_count=262144

#使用 sysctl -p 查看修改结果
sysctl -p
[3]、system call filters failed to install; check the logs and fix your configuration or disable system call filters at your own risk
原因:
这是在因为Centos6不支持SecComp,而ES5.2.0默认bootstrap.system_call_filter为true进行检测,所以导致检测失败,失败后直接导致ES不能启动。
解决:
在elasticsearch.yml中配置bootstrap.system_call_filter为false,注意要在Memory下面:
bootstrap.memory_lock: false
bootstrap.system_call_filter: false
实例配置:
[root@10-240-37-58 bin]# grep ^[a-z] ../config/elasticsearch.yml
cluster.name: my_es_cluster
node.name: es-node3
path.data: /data/elk/data
path.logs: /data/elk/logs
bootstrap.memory_lock: false
bootstrap.system_call_filter: false
network.host: 0.0.0.0
transport.tcp.port: 9300
transport.tcp.compress: true
http.port: 9200
discovery.zen.ping.unicast.hosts: ["10.240.37.56", "10.240.37.57","10.240.37.58"]
http.cors.enabled: true
http.cors.allow-origin: "*"
node.master: false
node.data: true
D.解决以上问题,则先启动 数据节点,最后启动主节点
cd /data/ops/app/elasticsearch-6.4.0
./bin/elasticsearch
F.当所有节点启动成功后,在主节点服务器执行以下curl命令,如下图所示,标识Elasticsearch集群启动成功。
[root@10-240-37-56 ~]# curl http://10.240.37.56:9200/_nodes/process?pretty
{
  "_nodes" : {
    "total" : 3,
    "successful" : 3,
    "failed" : 0
  },
2、安装 Kibana
2.1 下载安装Kibana
wget https://artifacts.elastic.co/downloads/kibana/kibana-6.4.0-linux-x86_64.tar.gz
tar -xzf kibana-6.4.0-linux-x86_64.tar.gz
mv kibana-6.4.0-linux-x86_64/ kibana-6.4.0
cd kibana-6.4.0/
2.2 配置kibana
vim config/kibana.yml
server.host: "10.240.37.56"
2.3 启动kibana
/data/ops/app/kibana-6.4.0-linux-x86_64/bin/kibana &
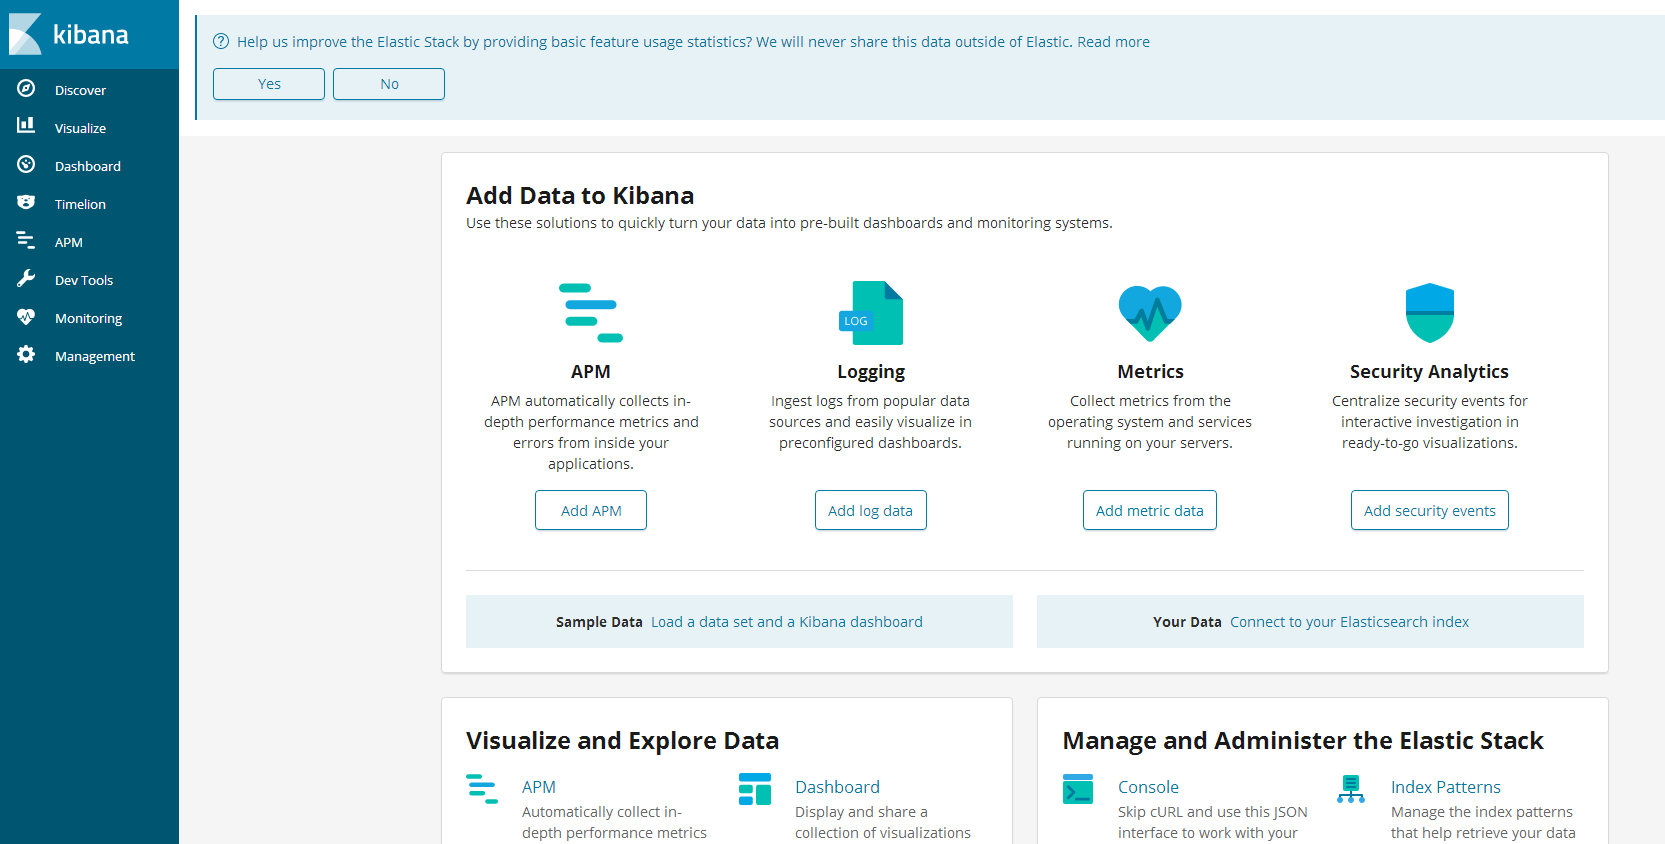
2.4 访问kibana,如下图所示,表示启动成功
http://10.240.37.56:5601/app/kibana
3、安装 Logstash 与 Filebeat
3.1 下载安装Logstash和Filebeat
# Logstash
wget https://artifacts.elastic.co/downloads/logstash/logstash-6.4.0.tar.gz
tar -xzf logstash-6.4.0.tar.gz
cd logstash-6.4.0


# Filebeat
wget https://artifacts.elastic.co/downloads/beats/filebeat/filebeat-6.4.0-linux-x86_64.tar.gz
tar -xzf filebeat-6.4.0-linux-x86_64.tar.gz
mv filebeat-6.4.0-linux-x86_64 filebeat-6.4.0
cd filebeat-6.4.0
3.2 配置Logstash、Filebeat 最新版引入module的概念,具体查看官方文档
官方参考地址:https://www.elastic.co/guide/en/logstash/6.4/advanced-pipeline.html
# Logstash-test.yml
cd logstash-6.4.0
vi logstash_test.conf

input{
  file {
    path => "/var/log/vsftpd.log"
    type => "ftp-log-226"
    start_position => "beginning"
    stat_interval => "2"
  }
}


output{
  if [type] == "ftp-log-226" {
    elasticsearch {
      hosts => ["10.240.37.56:9200"]
      index => "ftp-meizi-%{+YYYY.MM.dd}"
    }
  }
}
3.3 启动Logstash、Filebeat
#后台启动 filebeat
nohup ./filebeat -c ./filebeat.yml &

#启动Logstash
nohup ./bin/logstash -f logstash-test.conf &