1 第一阶段目标:
导入全国疫情数据库payiqing.sql(MySQL数据库)。
可以按照时期查询各个省市的疫情统计表格。
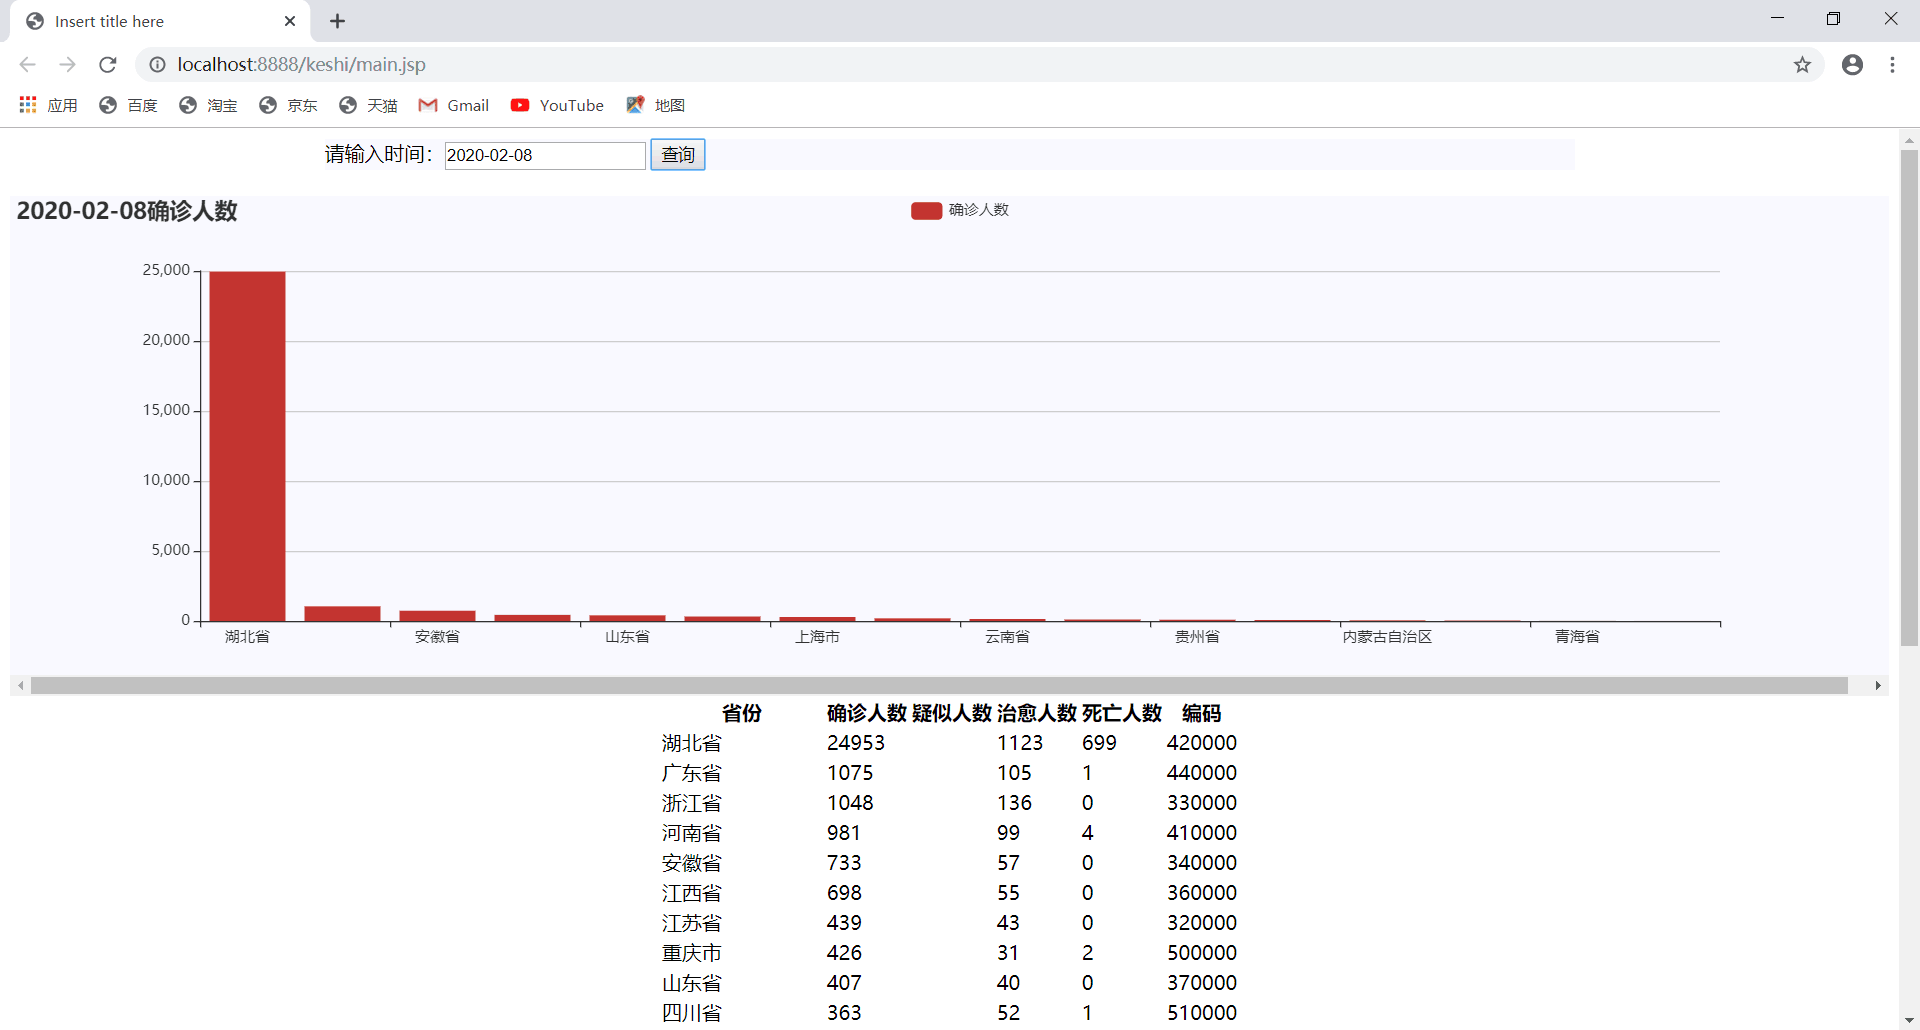
以折线图或柱状图展示某天的全国各省的确诊人数。
1.首先完成数据库的导入,然后编写数据库代码。建立DBUtil.java。实现相关数据的查询,并转化为json,以供Echart柱状图获取数据使用。
package dbutil;

import java.sql.Connection;
import java.sql.Date;
import java.sql.DriverManager;
import java.sql.PreparedStatement;
import java.sql.ResultSet;
import java.util.ArrayList;

import com.alibaba.fastjson.JSONArray;
import com.alibaba.fastjson.JSONObject;

import javabeen.Things;

public class DButil {
    //数据库URL和账号密码
        public static final String connectionURL="jdbc:mysql://localhost:3306/keshi?useUnicode=true&characterEncoding=GB18030&useSSL=false&serverTimezone=GMT&allowPublicKeyRetrieval=true";
        public static final String username="root";
        public static final String password="123456";
        static Connection connection;
        static ResultSet rSet;
        static PreparedStatement sql;
        //数据库连接
        public static Connection getConnection()
        {
            try {
                Class.forName("com.mysql.cj.jdbc.Driver");
                return DriverManager.getConnection(connectionURL, username, password);
            } catch (Exception e) {
                // TODO: handle exception
                System.out.println("数据库连接失败");
                e.printStackTrace();
            }
            return null;
        }
        public static String search(String  date)//查
        {
            try {

                connection=getConnection();
                sql=connection.prepareStatement("select * from info where Date like '"+date+"%' and  City=''");
                System.out.println(sql);
                rSet=sql.executeQuery();
                //ArrayList<Things> list =new ArrayList<>();

                JSONArray jsonArray=new JSONArray();
                while(rSet.next())
                {
                    //System.out.println(rSet.getString(3));
                    JSONObject json=new JSONObject();
                    json.put("name",rSet.getString(3) );
                    json.put("num", rSet.getString(5));
                    json.put("yisi",rSet.getString(6));
                    json.put("cure", rSet.getString(7));
                    json.put("dead", rSet.getString(8));
                    json.put("code", rSet.getString(9));
                    jsonArray.add(json);
                }
                return jsonArray.toString();
            } catch (Exception e) {
                // TODO: handle exception
                return null;
            }

        }
//        public static void main(String[] args) {
//            search("2020-02-12");
//        }

}
2.建立selvlet,接收jsp中的时间数据,并通过调用DBUtil中的方法获取数据并传回到jsp
package selvlet;

import java.io.IOException;
import java.util.ArrayList;

import javax.servlet.ServletException;
import javax.servlet.annotation.WebServlet;
import javax.servlet.http.HttpServlet;
import javax.servlet.http.HttpServletRequest;
import javax.servlet.http.HttpServletResponse;

import com.alibaba.fastjson.JSONArray;

import dbutil.DButil;
import javabeen.Things;

/**
 * Servlet implementation class Selvletsearch
 */
@WebServlet("/Selvletsearch")
public class Selvletsearch extends HttpServlet {
    private static final long serialVersionUID = 1L;

    protected void doGet(HttpServletRequest request, HttpServletResponse response) throws ServletException, IOException {

    }

    /**
     * @see HttpServlet#doPost(HttpServletRequest request, HttpServletResponse response)
     */
    protected void doPost(HttpServletRequest request, HttpServletResponse response) throws ServletException, IOException {
        // TODO Auto-generated method stub
        //doGet(request, response);
         request.setCharacterEncoding("utf-8");
         response.setContentType("text/html;charset=UTF-8");
           // String date=request.getParameter("date");
            response.getWriter().write(DButil.search(request.getParameter("date")));
    }

}
3.main.jsp 界面,实现柱状图的答印和各个地区疫情情况的数据的表格打印
<%@page import="com.alibaba.fastjson.JSON"%>
<%@ page language="java" contentType="text/html; charset=UTF-8"
    pageEncoding="UTF-8"%>
<!DOCTYPE html PUBLIC "-//W3C//DTD HTML 4.01 Transitional//EN" "http://www.w3.org/TR/html4/loose.dtd">
<html>
<head>
<meta http-equiv="Content-Type" content="text/html; charset=UTF-8">
<title>Insert title here</title>
 <script src="echarts.min.js"></script>
 <script src="https://cdn.staticfile.org/jquery/3.2.1/jquery.min.js"></script>
 <script src="https://cdn.staticfile.org/popper.js/1.15.0/umd/popper.min.js"></script>
 <script src="https://cdn.staticfile.org/twitter-bootstrap/4.3.1/js/bootstrap.min.js"></script>
<style>
            #one{
                /*border: 1px solid black;*/
                width: 1000px;
                height:auto;
                background-color: ghostwhite;
                margin: auto;
            }
            #main{
            width:1000px;
            height:outo;
            background-color: ghostwhite;
            margin: auto;
            }
            .table
            {
            margin: auto;
            }
</style>
</head>
<body>
        <div id="one">
            请输入时间:<input type="text" name="date" id="date" />
             <input type="submit" value="查询" onclick="search()">
        </div>
        <br/>
<div id="main" style=" 100%;height:400px;overflow: auto;"></div>
<table class="table">
        <thead class="head">
            </thead>
        <tbody class="main"></tbody>
    </table>
<script type="text/javascript">
        // 基于准备好的dom,初始化echarts实例
        var myChart = echarts.init(document.getElementById('main'));

        // 指定图表的配置项和数据
        myChart.showLoading();
        function search() {
            var date=$("#date").val();
           alert("查找成功");
            $.post(
                'Selvletsearch',
                {date:date},
                function(msg){
                    var json=JSON.parse(msg);
                    var size=json.length;
                    var names=[];
                    var nums=[];
                    for(i=0;i<size;i++){
                        names.push(json[i].name);
                        nums.push(json[i].num);
                        i++;
                    }
                    myChart.hideLoading();
                    var option = {
                            title: {
                                text: $("input[name=date]").val()+'确诊人数'
                            },
                            tooltip: {},
                            legend: {
                                data:['确诊人数']
                            },
                            xAxis: {
                                data: names
                            },
                            yAxis: {},
                            series: [{
                                name: '确诊人数',
                                type: 'bar',
                                data: nums
                            }]
                        };
                  myChart.setOption(option);
                  tr="<tr><th>省份</th><th>确诊人数</th><th>疑似人数</th><th>治愈人数</th><th>死亡人数</th><th>编码</th></tr>";
                  $('.head').append(tr);
                  for(i=0;i<size;i++)
                      $('.main').append("<tr></tr>");
                  $('.main tr').each(function(i){
                      $(this).append("<td>"+json[i].name+"</td>");
                      $(this).append("<td>"+json[i].num+"</td>");
                      $(this).append("<td>"+json[i].yisi+"</td>");
                      $(this).append("<td>"+json[i].cure+"</td>");
                      $(this).append("<td>"+json[i].dead+"</td>");
                      $(this).append("<td>"+json[i].code+"</td>");
                  })

                },
               //"json"
                );

        }

   </script>
</body>
</html>
实验结果:
