In this quickstart you will learn how to embed a Power BI Report Server report by using an iFrame in a SharePoint page. If you are working with SharePoint Online, Power BI Report Server must be publicly accessible. In SharePoint Online, the Power BI Web Part that works with the Power BI service doesn’t work with Power BI Report Server.
Prerequisites
- You will need to have Power BI Report Server installed and configured.
- You will need to have Power BI Desktop optimized for Power BI Report Server installed.
- You will need to have a SharePoint environment installed and configured.
Creating the Power BI Report Server report URL
-
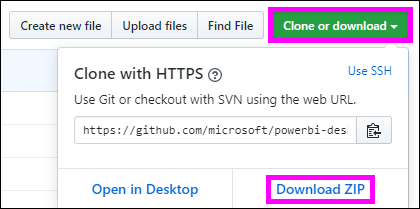
Download the sample from GitHub - Blog Demo.
-
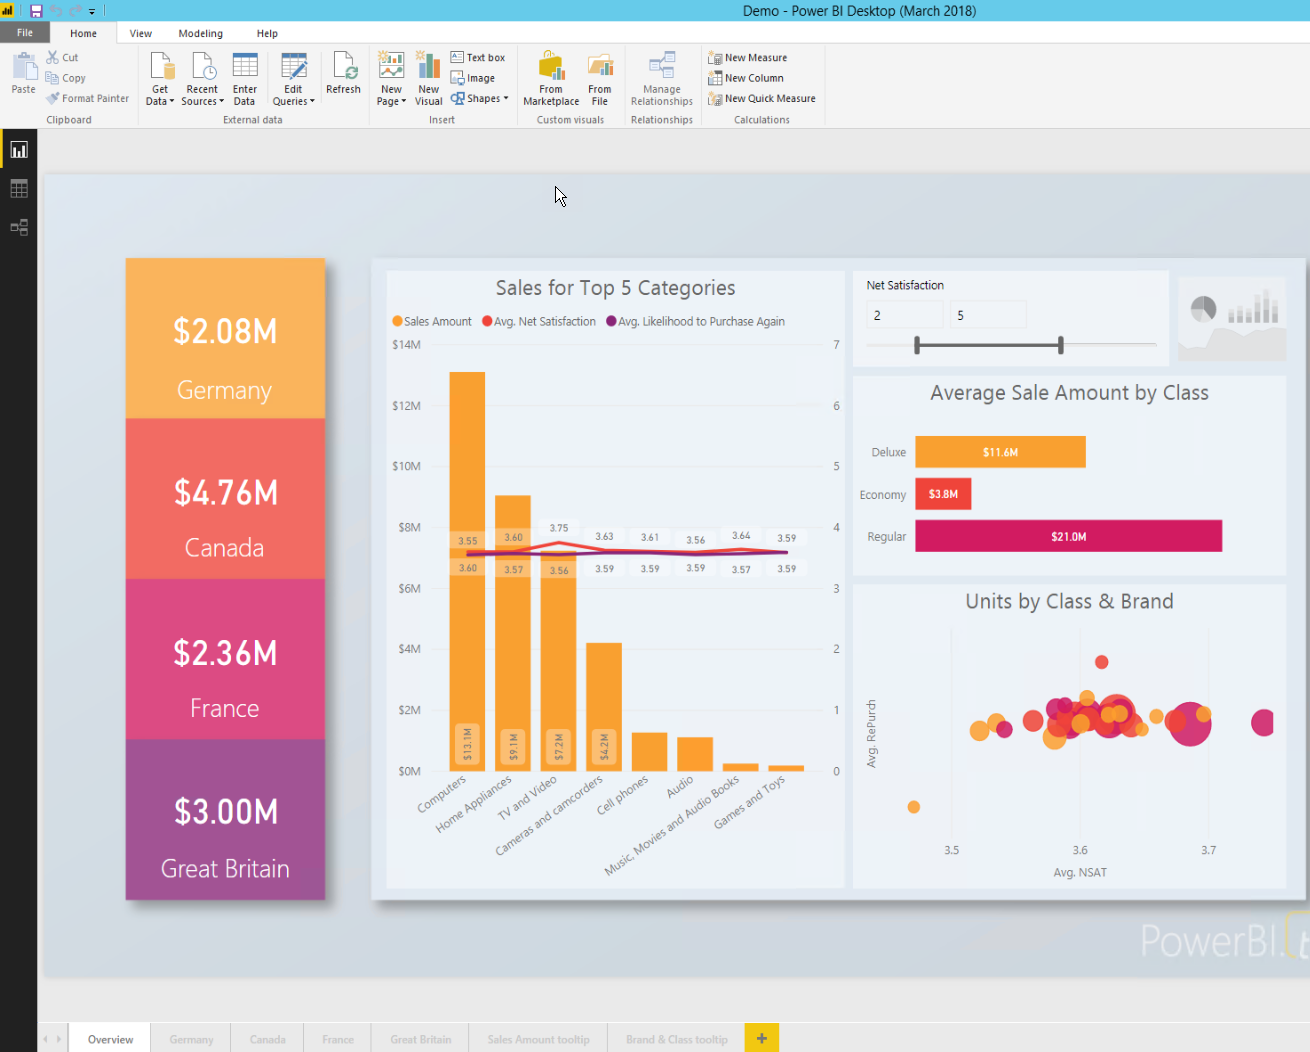
Open the sample PBIX file from GitHub in Power BI Desktop optimized for Power BI Report Server.
-
Save the report to the Power BI Report Server.

-
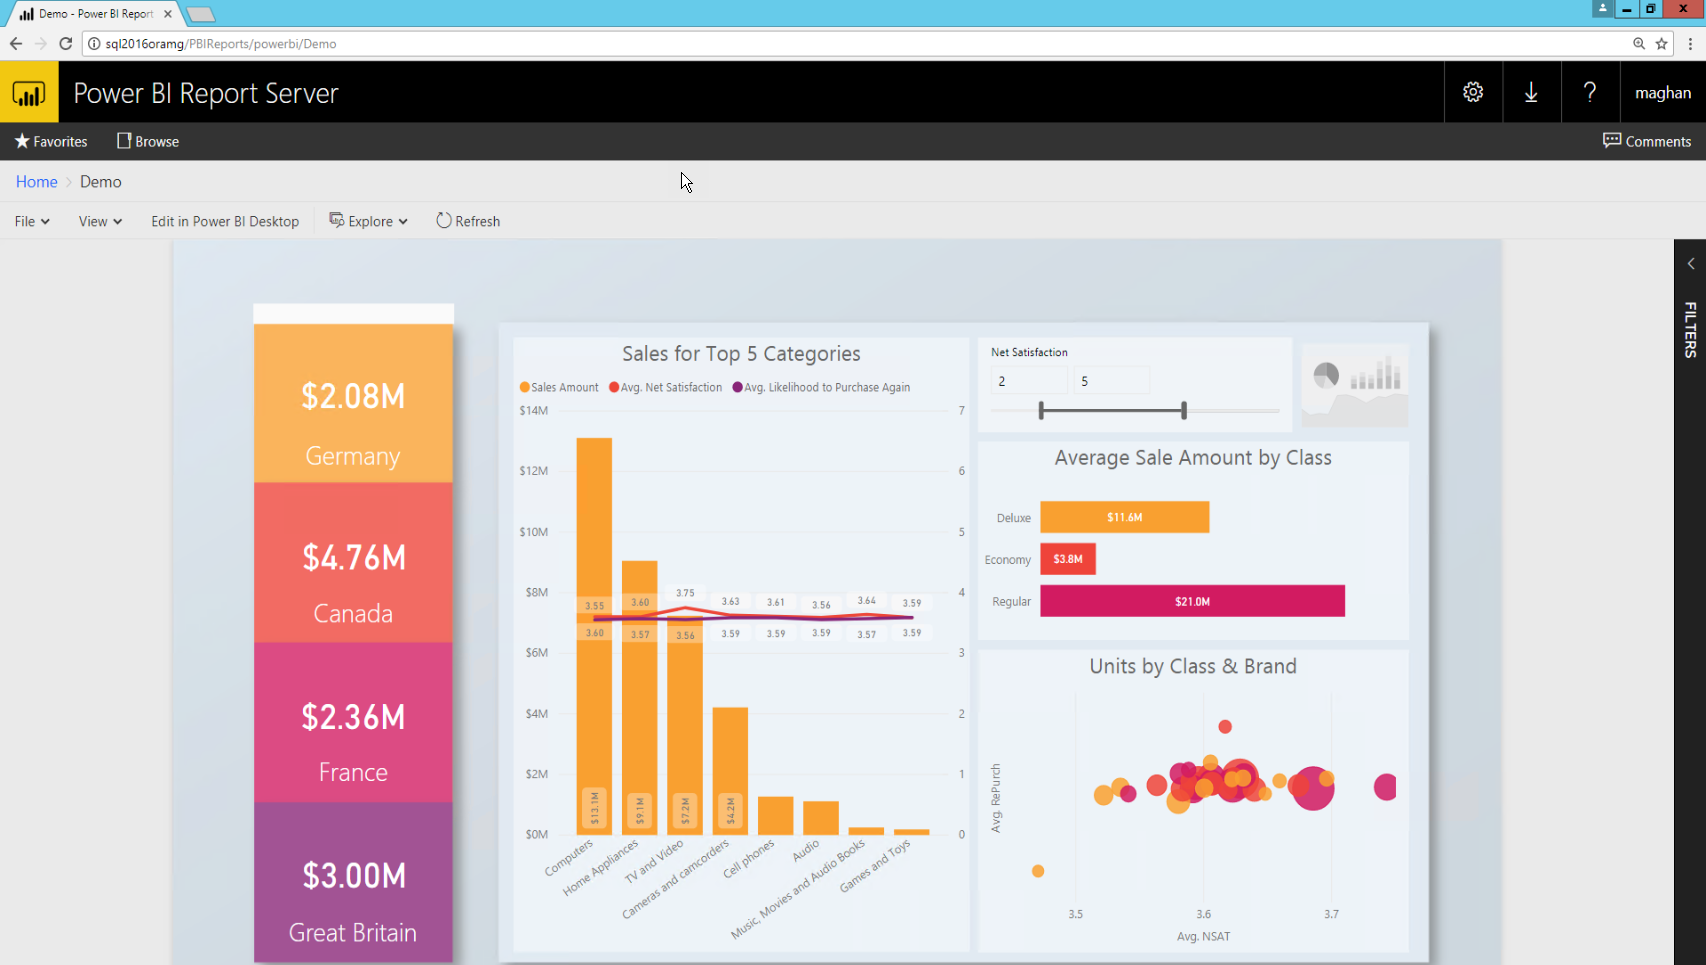
View report in the Web Portal.
Capturing the URL parameter
Once you have your URL, you can create an iFrame within a SharePoint page, to host the report. For any Power BI Report Server report URL you can add a querystring parameter of ?rs:embed=true to embed your report into an iFrame.
For example: http://myserver/reports/powerbi/Sales?rs:embed=true
Embedding a Power BI Report Server report in a SharePoint iFrame
-
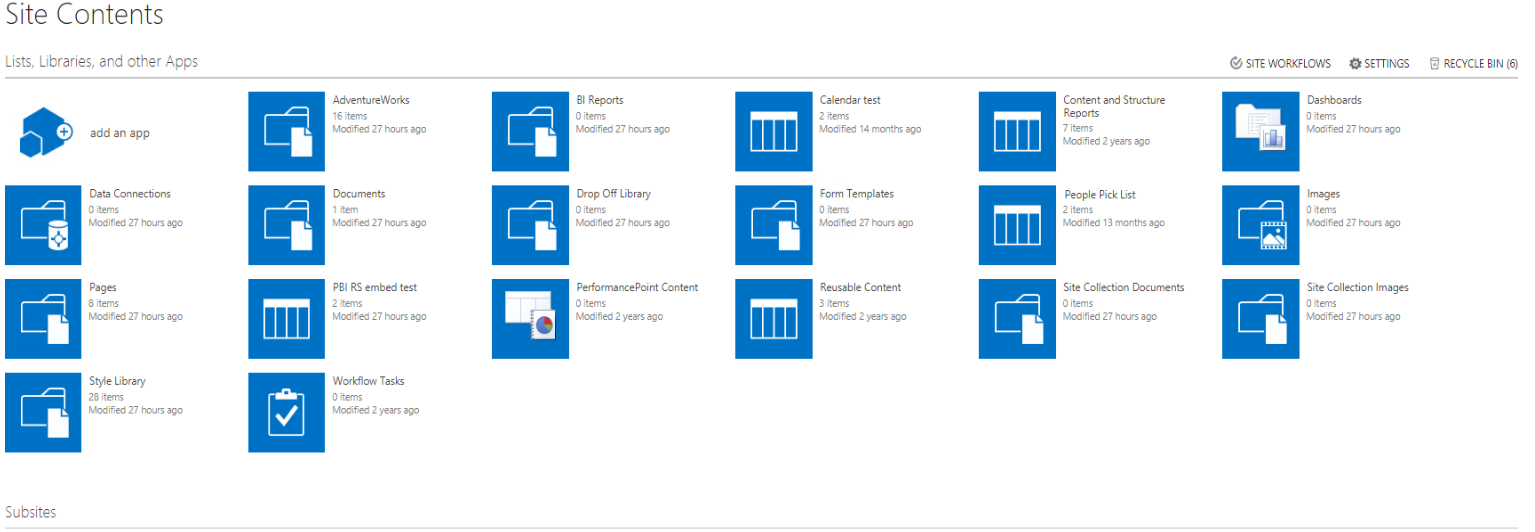
Navigate to a SharePoint Site Contents page.
-
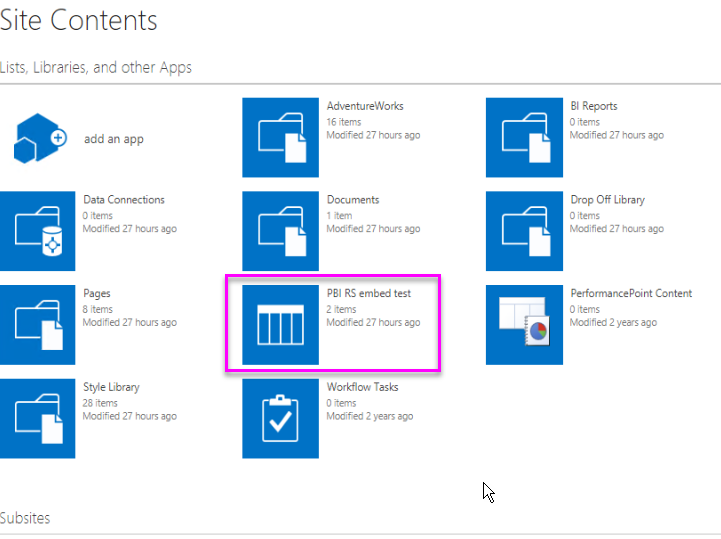
Choose the page where you want to add your report.
-
Select the gear on the top right and select Edit Page.

-
Select Add Web Part.

-
Under Categories select Media and Content, under Parts, select Content Editor, and then select Add.


-
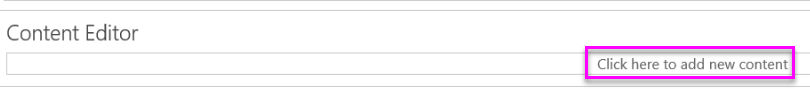
Select Click here to add new content.
-
In the ribbon select the Format Text tab then select Edit Source.

-
In the Edit Source window paste your iFrame code and select OK.

For example:
<iframe width="800" height="600" src="http://myserver/reports/powerbi/Sales?rs:embed=true" frameborder="0" allowFullScreen="true"></iframe> -
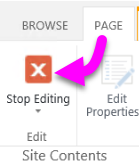
In the ribbon select the Page tab and select Stop Editing.
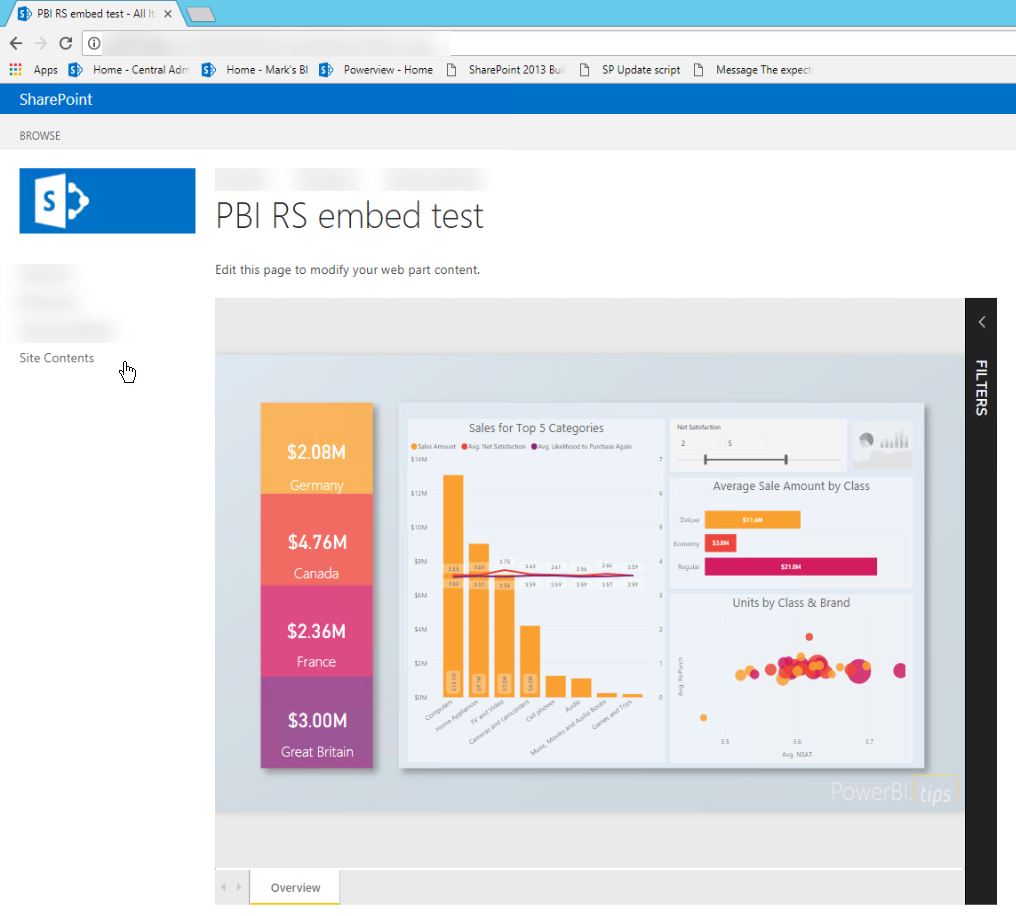
-
Now you should see the report on the page.