问题情形
通过Application Insights收集到指标数据后,如Request,Trace,Exception。但是默认的Insights图表不能满足业务的需求,需要自定义相应的类SQL语句并制作图表以便直观的显示,避免每次都需要重新查询数据并转换为图表。
类SQL的查询语句在Applicaiton Insights示例为:
// Response time trend
// Chart request duration over the last 12 hours.
requests
| where timestamp > ago(12h)
| summarize avgRequestDuration=avg(duration) by bin(timestamp, 10m) // use a time grain of 10 minutes
| render timechart

// Operations performance
// Calculate request count and duration by operations.
requests
| summarize RequestsCount=sum(itemCount), AverageDuration=avg(duration), percentiles(duration, 50, 95, 99) by operation_Name // you can replace 'operation_Name' with another value to segment by a different property
| order by RequestsCount desc // order from highest to lower (descending)


// Top 10 countries by traffic
// Chart the amount of requests from the top 10 countries.
requests
| summarize CountByCountry=count() by client_CountryOrRegion
| top 10 by CountByCountry
| render piechart


// Top 3 browser exceptions
// What were the highest reported exceptions today?
exceptions
| where notempty(client_Browser) and client_Type == 'Browser'
| summarize total_exceptions = sum(itemCount) by problemId
| top 3 by total_exceptions desc

// Failed requests – top 10
// What are the 3 slowest pages, and how slow are they?
requests
| where success == false
| summarize failedCount=sum(itemCount) by name
| top 10 by failedCount desc
| render barchart

// Failed operations
// Calculate how many times operations failed, and how many users were impacted.
requests
| where success == false
| summarize failedCount=sum(itemCount), impactedUsers=dcount(user_Id) by operation_Name
| order by failedCount desc
操作步骤
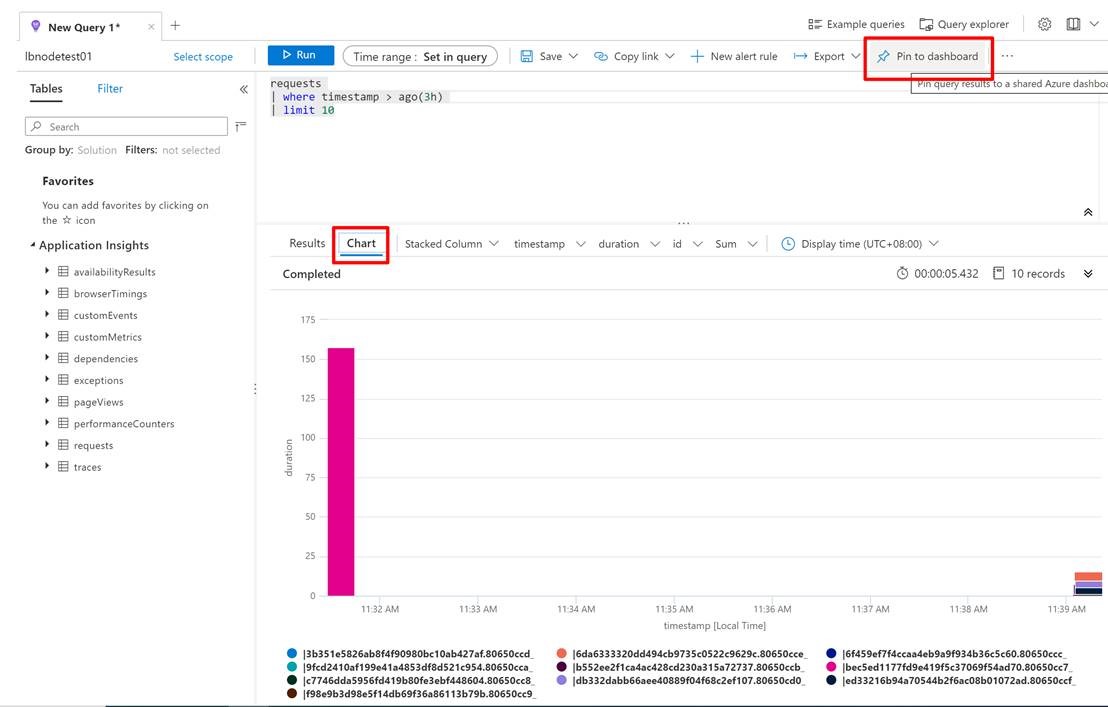
Application Insights提供了非常简单的办法来完成制作图表的步骤,只需要在Logs页面中,按照上面的类SQL语句写好后,点击右上角的固定到仪表盘(Pin To Dashboard)即可。
参考资料:
创建诊断设置以在 Azure 中收集资源日志和指标:https://docs.azure.cn/zh-cn/azure-monitor/platform/diagnostic-settings