zoukankan      html  css  js  c++  java
  • echart常见配置,持续更新中.....

    场景一:折线图

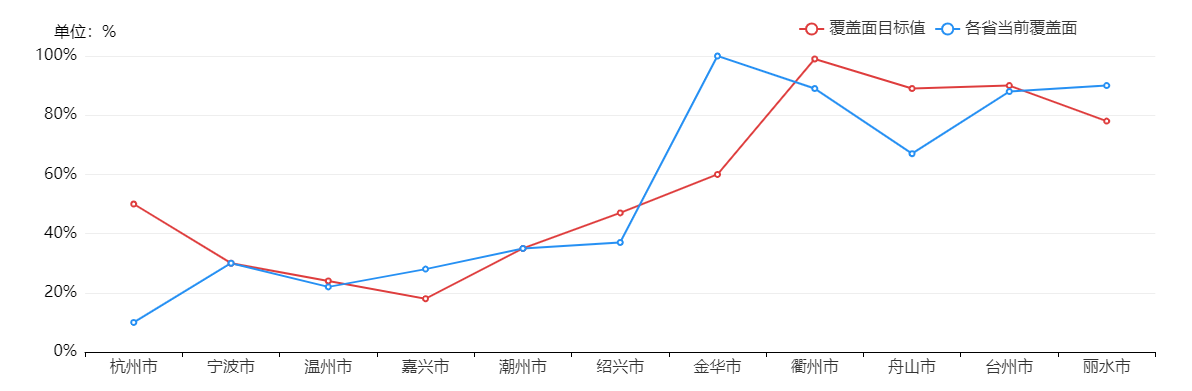
    options = {
      backgroundColor:"#ffffff",
      grid: {  //折线图距离canvas的距离,会拉伸图例
        left: '4%',
        right: '4%',
        bottom: '5%',
        top:"15%",
        containLabel: true
      },
      legend: {
        data: ['覆盖面目标值', '各省当前覆盖面'],
        right:"10%",
        top:"5%",
        textStyle:{
            fontSize:16
        }
      },
      xAxis: {
          type: "category",
          axisLine: {
            lineStyle: {
              show: true,
              color: "#000",
            },
          },
          axisLabel: {
            textStyle: {
              color: "#333", // 坐标值得具体的颜色
              fontSize:16
            },
          },
          splitLine: { show: false },
          splitArea: { show: false },
          data: ['杭州市', '宁波市', '温州市', '嘉兴市', '潮州市', '绍兴市', '金华市','衢州市','舟山市','台州市','丽水市']
      },
      tooltip: {
        trigger: 'axis',
        // formatter: '{b0}: {c0}<br />{b1}: {c1}',
      },
      yAxis: {
        type: 'value',
         max:100,
         splitArea: {
             show: false,
             areaStyle: {
                color: ['rgba(216,216,216,0.08)', 'rgba(216,216,216,0.04)']
             }
        },
         axisLabel:{ 
            formatter:'{value}%',
            color:"#000000",
            fontSize:16
         },
         name:'单位:%',
         nameTextStyle:{
            color:"#000000",
            fontSize:16
        }
      },
      
      series: [
        {
            data: [50, 30, 24, 18, 35, 47, 60,99,89,90,78],
            name:"覆盖面目标值",
            type: 'line',
            smooth: false,
            symbolSize:5,
            itemStyle:{
              normal:{
                // 拐点上显示数值
                label : {
                    show: false
                },
                borderColor:'red',  // 拐点边框颜色
                lineStyle:{                 
                  2,  // 设置线宽
                  borderColor:'#de3d3d',
                  type:'solid'  //'dotted'虚线 'solid'实线
                }
              }
            }
        },
        {
          data: [10, 30, 22, 28, 35, 37, 100,89,67,88,90],
          name:"各省当前覆盖面",
          type: 'line',
          smooth: false,
          symbolSize:5,
          itemStyle:{
              normal:{
                // 拐点上显示数值
                label : {
                    show: false
                },
                borderColor:'red',  // 拐点边框颜色
                lineStyle:{                 
                  2,  // 设置线宽
                  borderColor:'#2690f3',
                  type:'solid'  //'dotted'虚线 'solid'实线
                }
              }
            }
        }
      ],
      color:['#de3d3d','#2690f3']
    }

    场景二:水球图

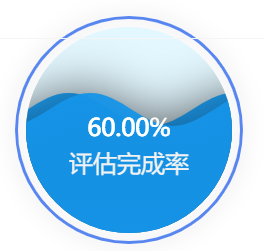
    var value = 0.6;
    let options = {
        title: {
            text: '',
        },
        graphic: [
              {
                type: 'group',
                left: 'center',
                top: '58%',
                children: [
                  {
                    type: 'text',
                    z: 100,
                    
                    style: {
                      fill: '#f2f2f2',
                      text: '评估完成率',
                      fontSize:'24px'
                    },
                  },
                ],
              },
            ],
        series: [
            {
                type: 'liquidFill',
                radius: '75%',
                center: ['50%', '50%'],
                color: [
                    {
                        type: 'linear',
                        x: 0,
                        y: 0,
                        x2: 0,
                        y2: 1,
                        colorStops: [
                            {
                                offset: 0,
                                color: '#1594e8', // 0% 处的颜色
                            },
                            {
                                offset: 1,
                                color: '#1594e8', // 100% 处的颜色
                            },
                        ],
                    },
                ],
                data: [value, value], // data个数代表波浪数
                backgroundStyle: {
                    borderWidth: 0,
                    borderColor: '#ffffff',
                    color: '#e3f7ff',
                },
                label: {
                  show: true,
                  textStyle: {
                    color: '#ffffff',
                    insideColor: '#12786f',
                    fontSize: 24,
                    fontWeight:'normal'
                  },
                  formatter: (params) => {
                    return `${(params.value * 100).toFixed(2)}%`;
                  },
                },
                outline: {
                    borderDistance: 8,          // 外边框与内边框间的距离
                    itemStyle: {
                        borderWidth: 3,         // 外边框的宽度
                        borderColor: '#5886f0',
                    }
                },
            },
        ],
    };

    场景三:环形进度图

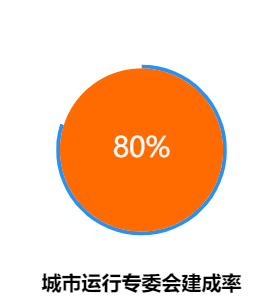
    options={
        title: {
            text: '城市运行专委会建成率',
            x: 'center',
            y: '90%',
            hoverAnimation: false,
            textStyle: {
                fontWeight: 'bold',
                color: '#000000',
                fontSize: '20'
            }
        },
        color: ['rgba(176, 212, 251, 1)'],
        legend: {
            show: false,
            itemGap: 12,
            data: ['01']
        },
        series: [{
            name: 'Line 1',
            type: 'pie',
            clockWise: true,
            radius: ['0', '65%'],
            labelLine: {
                show: false
            },
            label:{
                normal:{
                    position:'center',
                    fontWeight: 'normal',
                    color: '#ffffff',
                    fontSize: '28'
                }
            },
            itemStyle: {
                normal: {
                    label: {
                        show: true
                    },
                    labelLine: {
                        show: false
                    }
                }
            },
            hoverAnimation: false,
            data: [{
                name:'80%',
                value: 80,
                itemStyle: {
                    normal: {
                        hoverAnimation: false,
                        color: {
                            colorStops: [{
                                offset: 0,
                                color: 'rgb(255 107 0)'
                            }, {
                                offset: 1,
                                color: 'rgb(255 107 0)'
                            }]
                        },
                        label: {
                            show: false
                        },
                        labelLine: {
                            show: false
                        }
                    }
                }
            }, {}]
        }, {
            type: 'pie',
            radius: ['65%', '68%'],
            labelLine: {
                show: false
            },
            
            hoverAnimation: false,
            startAngle: [90],
            data: [{
                value:80,
                hoverAnimation: false,
                itemStyle: {
                    normal: {
                        color: {
                            colorStops: [{
                                offset: 0,
                                color: '#2690f3'
                            }]
                        },
                        label: {
                            show: true
                        },
                        labelLine: {
                            show: false
                        }
                    }
                }
            },{
                value: 20,
                hoverAnimation: false,
                itemStyle: {
                    normal: {
                        color: {
                            colorStops: [{
                                offset: 0,
                                color: '#ffffff'
                            }]
                        },
                        label: {
                            show: true
                        },
                        labelLine: {
                            show: false
                        }
                    }
                }
            }]
        }]
    }

    场景四:环形比例图

    options = {
        title: [{
            text: '普查率完成率',
            x: 'center',
            y: '38%',
            textStyle: {
                fontWeight: 'normal',
                color: '#ffffff',
                fontSize: '18'
            }
        },
        {
         text: '55.98%',
            x: 'center',
            y: '50%',
            textStyle: {
                fontWeight: 'normal',
                color: '#ffffff',
                fontSize: '18'
            }
        }
        ],
        color: ['rgba(176, 212, 251, 1)'], 
        legend: {
            show: false,
            itemGap: 12,
            data: ['01']
        },
       
        series: [{
            type: 'pie',
            clockWise: true,
            radius: ['0%', '60%'],
            itemStyle:{
                normal: {
                    label: {
                        show: false
                    },
                    labelLine: {
                        show: false
                    }
                }
            },
            hoverAnimation: false, 
            data: [{
                value: 100,
                name: '01',
                itemStyle: {
                    normal: {
                        color:'#003e78' ,
                        label: {
                            show: false
                        },
                        labelLine: {
                            show: false
                        }
                    } 
                }
            }]
        },{
            name: 'Line 1',
            type: 'pie',
            clockWise: true,
            radius: ['60%', '85%'],
            itemStyle: {
                normal: {
                    label: {
                        show: false
                    },
                    labelLine: {
                        show: false
                    }
                }
            },
            hoverAnimation: false, 
            data: [{
                value: 55.98,
                name: '01',
                itemStyle: {
                    normal: {
                        color:'#37c76a' ,
                        label: {
                            show: false
                        },
                        labelLine: {
                            show: false
                        }
                    } 
                }
            }, {
                value:44.02,
                name: '01',
                itemStyle: {
                    normal: {
                        color:'#da2626' ,
                        label: {
                            show: false
                        },
                        labelLine: {
                            show: false
                        }
                    } 
                } 
            
            }]
        }]
    }

     场景五:叠加柱状图


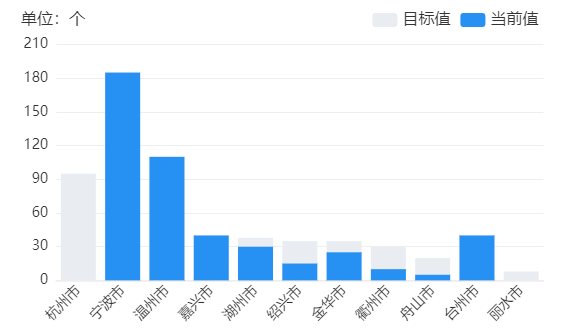
    options = {
            color:["#7179CB","#4CCEFE"],
            title: {
                text:"单位:个",
                textStyle:{
                    fontSize:16,
                    color: '#333'
                },
                top:'15',
                left:'15',
            },
            grid: {
                left: '4%',
                right: '4%',
                bottom: '4%',
                top:"15%",
                containLabel: true
              },
            legend: {
              right:"4%",
              top:"15",
              textStyle:{
                fontSize:16
              }
            },
            tooltip: {
              trigger: 'axis',
              backgroundColor:'#ffffff'
            },
            xAxis: {
                data: ['杭州市','宁波市','温州市','嘉兴市','湖州市','绍兴市','金华市','衢州市','舟山市','台州市','丽水市'],
                axisLabel:{
                    interval:0,//横轴信息全部显示
                    rotate:45,//-30度角倾斜显示
                    textStyle:{
                        color: '#333',
                         fontSize:14
                    }
                },
                axisLine: {
                  lineStyle: {
                    show: true,
                    color: "#eeeeee",
                    1.5
                  },
                },
                axisTick: {
                  show: false,
                },
            },
            yAxis: {
                splitArea: {show: false},
                axisLabel: {
                    textStyle:{
                        color: '#333',
                        fontSize:14
                    }
                }
            },
            series: [
                {
                    barWidth: 35,
                    data:  ["95", "185", "110", "40","38", "35", "35", "30","20", "40", "8"],
                    name: "目标值",
                    type: "bar",
                    itemStyle: {
                        normal: {
                             color: '#e9edf2',
                        }
                    },
                },
                {
                    barGap: "-100%", /*这里设置包含关系,只需要这一句话*/
                    barWidth: 35,
                    data: ["0", "185", "110", "40","30", "15", "25", "10","5", "40", "0" ],
                    name: "当前值",
                    type: "bar",
                    itemStyle: {
                        normal: {
                            color: '#2690f3',
                        }
                    },
             
                }
            ]
        };

    ···

  • 相关阅读:
    解锁 redis 锁的正确姿势
    PHP实现Redis单据锁,防止并发重复写入
    js笔记
    FormData使用方法详解
    jquery里用each遍历的值存到数组和字符串
    Sublime Text3 安装 CTags 插件出现乱码
    通过pd.to_sql()将DataFrame写入Mysql
    ERROR 2002 (HY000): Can't connect to local MySQL server through socket
    pandas 从txt读取DataFrame&DataFrame格式化保存到txt
    pandas 取消读取csv时默认第一行为列名
  • 原文地址:https://www.cnblogs.com/wxyblog/p/15357969.html
Copyright © 2011-2022 走看看