啰嗦: 现在大家利用Highcharts开发时,有时候会遇到导出的功能问题,但是highcharts默认是链接自己的服务器上进行处理,但是有时候我们会连不上他的服务器,所以我们要让他在我们的服务器上进行处理
平台: asp.net mvc4
开发工具: visual studio 2013
第三方插件:highcharts包、itextsharp.dll、Svg.dll
mvc的基础不说。博客园上的mvc入门太多了
1、建立MVC4 选择基本模板(有jquery)
2、引用Highcharts库(下载的包里只需要js这个文件夹)
3、引用itextsharp.dll、Svg.dll
4、建立HomeController 和 Action
图下:
因为引用_Layout.cshtml做为母视图 _Layout 定义了 scripts section 直接在Index.cshtml引用highcharts 必要的两个JS文件 Highcharts/highchart.js 和Highcharts/modules/exporting.js
Highcharts/modules/exporting.js是关于导出的js 待会修改
在Index.cshtml加入highcharts现成的例子
Index.cshtml内容:
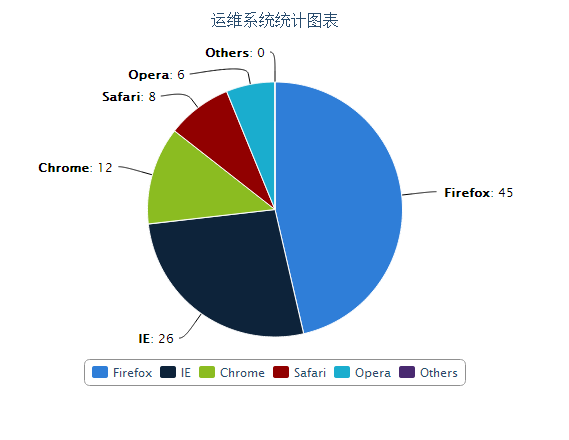
<div id="container" style="min- 310px; min-height: 400px; margin: 0 auto"></div>
@section scripts
{
    <script type="text/javascript" src="@Url.Content("~/Highcharts/highcharts.js")"></script>
    <script type="text/javascript" src="@Url.Content("~/Highcharts/modules/exporting.js")"></script>
    <script type="text/javascript">
        $(function () {
            $('#container').highcharts({
                chart: {
                    plotBackgroundColor: null,
                    plotBorderWidth: null,
                    plotShadow: true
                },
                title: {
                    text: '运维系统统计图表'
                },
                tooltip: {
                    pointFormat: '{series.name}: <b>{point.y}</b>'
                },
                plotOptions: {
                    pie: {
                        allowPointSelect: true,
                        cursor: 'pointer',
                        dataLabels: {
                            enabled: true,
                            color: '#000000',
                            connectorColor: '#000000',
                            format: '<b>{point.name}</b>: {point.y}'
                        },
                        showInLegend: true
                    }
                },
                series: [{
                    type: 'pie',
                    name: '总数',
                    data: [{ name: 'Firefox', y: 45 },
                        { name: 'IE', y: 26 },
                        { name: 'Chrome', y: 12 },
                        { name: 'Safari', y: 8 },
                        { name: 'Opera', y: 6 },
                        { name: 'Others', y: 0 }]
                }]
            });
        });
    </script>
}
效果:
5、在HomeController里编写Export Action
MemoryStream 在 System.IO命名空间下
SvgDocument 需要引用Svg.dll里
ImageFormat 需要引用System.Drawing;
PdfWriter和Document 需要引用itextsharp.dll
HomeController.cs内容如下:
using iTextSharp.text;
using iTextSharp.text.pdf;
using Svg;
using System;
using System.Collections.Generic;
using System.Drawing.Imaging;
using System.IO;
using System.Linq;
using System.Text;
using System.Web;
using System.Web.Mvc;

namespace HighchartsExportMVC.Controllers
{
    public class HomeController : Controller
    {
        //
        // GET: /Home/

        public ActionResult Index()
        {
            return View();
        }


        //HighCharts 导出图片 svg
        //filename type width scale svg
        [HttpPost]
        [ValidateInput(false)]
        public ActionResult Export(FormCollection fc)
        {
            string tType = fc["type"];
            string tSvg = fc["svg"];
            string tFileName = fc["filename"];
            if (string.IsNullOrEmpty(tFileName))
                tFileName = "chart";
            MemoryStream tData = new MemoryStream(Encoding.UTF8.GetBytes(tSvg));
            MemoryStream tStream = new MemoryStream();
            string tTmp = new Random().Next().ToString();
            string tExt = "";
            string tTypeString = "";

            switch (tType)
            {
                case "image/png":
                    tTypeString = "-m image/png";
                    tExt = "png";
                    break;
                case "image/jpeg":
                    tTypeString = "-m image/jpeg";
                    tExt = "jpg";
                    break;
                case "application/pdf":
                    tTypeString = "-m application/pdf";
                    tExt = "pdf";
                    break;
                case "image/svg+xml":
                    tTypeString = "-m image/svg+xml";
                    tExt = "svg";
                    break;
            }

            if (tTypeString != "")
            {
                string tWidth = fc["width"];
                Svg.SvgDocument tSvgObj = SvgDocument.Open(tData);

                switch (tExt)
                {
                    case "jpg":
                        tSvgObj.Draw().Save(tStream, ImageFormat.Jpeg);
                        break;
                    case "png":
                        tSvgObj.Draw().Save(tStream, ImageFormat.Png);
                        break;
                    case "pdf":
                        PdfWriter tWriter = null;
                        Document tDocumentPdf = null;
                        try
                        {
                            tSvgObj.Draw().Save(tStream, ImageFormat.Png);
                            tDocumentPdf = new Document(new iTextSharp.text.Rectangle((float)tSvgObj.Width, (float)tSvgObj.Height));
                            tDocumentPdf.SetMargins(0.0f, 0.0f, 0.0f, 0.0f);
                            iTextSharp.text.Image tGraph = iTextSharp.text.Image.GetInstance(tStream.ToArray());
                            tGraph.ScaleToFit((float)tSvgObj.Width, (float)tSvgObj.Height);

                            tStream = new MemoryStream();
                            tWriter = PdfWriter.GetInstance(tDocumentPdf, tStream);
                            tDocumentPdf.Open();
                            tDocumentPdf.NewPage();
                            tDocumentPdf.Add(tGraph);
                            tDocumentPdf.Close();
                        }
                        catch (Exception ex)
                        {
                            throw ex;
                        }
                        finally
                        {
                            tDocumentPdf.Close();
                            tWriter.Close();
                            tData.Dispose();
                            tData.Close();

                        }
                        break;
                    case "svg":
                        tStream = tData;
                        break;
                }
            }
            return File(tStream.ToArray(), tType, tFileName);
        }

    }
}
OK 服务端处理已经完成,现在就要修改Highcharts/modules/exporting.js文件
稍微格式化一下代码
/* Highcharts JS v3.0.7 (2013-10-24) Exporting module (c) 2010-2013 Torstein Hønsi License: www.highcharts.com/license */ (function (f) { var A = f.Chart, t = f.addEvent, C = f.removeEvent, k = f.createElement, n = f.discardElement, u = f.css, o = f.merge, r = f.each, p = f.extend, D = Math.max, j = document, B = window, E = f.isTouchDevice, F = f.Renderer.prototype.symbols, x = f.getOptions(), y; p(x.lang, { printChart: "打印该页", downloadPNG: "下载PNG图片", downloadJPEG: "下载JPEG图片", downloadPDF: "下载PDF图片", downloadSVG: "下载SVG图片", contextButtonTitle: "功能菜单" }); x.navigation = { menuStyle: { border: "1px solid #A0A0A0", background: "#FFFFFF", padding: "5px 0" }, menuItemStyle: { padding: "0 10px", background: "none", color: "#303030", fontSize: E ? "14px" : "11px" }, menuItemHoverStyle: { background: "#4572A5", color: "#FFFFFF" }, buttonOptions: { symbolFill: "#E0E0E0", symbolSize: 14, symbolStroke: "#666", symbolStrokeWidth: 3, symbolX: 12.5, symbolY: 10.5, align: "right", buttonSpacing: 3, height: 22, theme: { fill: "white", stroke: "none" }, verticalAlign: "top", 24 } }; x.exporting = { type: "image/png", url: "/OAMA/Count/Export", buttons: { contextButton: { menuClassName: "highcharts-contextmenu", symbol: "menu", _titleKey: "contextButtonTitle", menuItems: [{ textKey: "printChart", onclick: function () { this.print() } }, { separator: !0 }, { textKey: "downloadPNG", onclick: function () { this.exportChart() } }, { textKey: "downloadJPEG", onclick: function () { this.exportChart({ type: "image/jpeg" }) } }, { textKey: "downloadPDF", onclick: function () { this.exportChart({ type: "application/pdf" }) } }, { textKey: "downloadSVG", onclick: function () { this.exportChart({ type: "image/svg+xml" }) } }] } } }; f.post = function (c, a) { var d, b; b = k("form", { method: "post", action: c, enctype: "multipart/form-data" }, { display: "none" }, j.body); for (d in a) k("input", { type: "hidden", name: d, value: a[d] }, null, b); b.submit(); n(b) }; p(A.prototype, { getSVG: function (c) { var a = this, d, b, z, h, g = o(a.options, c); if (!j.createElementNS) j.createElementNS = function (a, b) { return j.createElement(b) }; c = k("div", null, { position: "absolute", top: "-9999em", a.chartWidth + "px", height: a.chartHeight + "px" }, j.body); b = a.renderTo.style.width; h = a.renderTo.style.height; b = g.exporting.sourceWidth || g.chart.width || /px$/.test(b) && parseInt(b, 10) || 600; h = g.exporting.sourceHeight || g.chart.height || /px$/.test(h) && parseInt(h, 10) || 400; p(g.chart, { animation: !1, renderTo: c, forExport: !0, b, height: h }); g.exporting.enabled = !1; g.series = []; r(a.series, function (a) { z = o(a.options, { animation: !1, showCheckbox: !1, visible: a.visible }); z.isInternal || g.series.push(z) }); d = new f.Chart(g, a.callback); r(["xAxis", "yAxis"], function (b) { r(a[b], function (a, c) { var g = d[b][c], f = a.getExtremes(), h = f.userMin, f = f.userMax; g && (h !== void 0 || f !== void 0) && g.setExtremes(h, f, !0, !1) }) }); b = d.container.innerHTML; g = null; d.destroy(); n(c); b = b.replace(/zIndex="[^"]+"/g, "") .replace(/isShadow="[^"]+"/g, "") .replace(/symbolName="[^"]+"/g, "") .replace(/jQuery[0-9]+="[^"]+"/g, "") .replace(/url([^#]+#/g, "url(#") .replace(/<svg /, '<svg xmlns:xlink="http://www.w3.org/1999/xlink" ') .replace(/ href=/g, " xlink:href=") .replace(/ /, " ") .replace(/</svg>.*?$/, "</svg>") .replace(/ /g, " ") .replace(/­/g, "") .replace(/<IMG /g, "<image ") .replace(/height=([^" ]+)/g, 'height="$1"') .replace(/width=([^" ]+)/g, 'width="$1"') .replace(/hc-svg-href="([^"]+)">/g, 'xlink:href="$1"/>') .replace(/id=([^" >]+)/g, 'id="$1"') .replace(/class=([^" >]+)/g, 'class="$1"') .replace(/ transform /g, " ") .replace(/:(path|rect)/g, "$1") .replace(/style="([^"]+)"/g, function (a) { return a.toLowerCase() }); return b = b.replace(/(url(#highcharts-[0-9]+)"/g, "$1").replace(/"/g, "'") }, exportChart: function (c, a) { var c = c || {}, d = this.options.exporting, d = this.getSVG(o({ chart: { borderRadius: 0 } }, d.chartOptions, a, { exporting: { sourceWidth: c.sourceWidth || d.sourceWidth, sourceHeight: c.sourceHeight || d.sourceHeight } })), c = o(this.options.exporting, c); f.post(c.url, { filename: c.filename || "chart", type: c.type, c.width || 0, scale: c.scale || 2, svg: d }) }, print: function () { var c = this, a = c.container, d = [], b = a.parentNode, f = j.body, h = f.childNodes; if (!c.isPrinting) c.isPrinting = !0, r(h, function (a, b) { if (a.nodeType === 1) d[b] = a.style.display, a.style.display = "none" }), f.appendChild(a), B.focus(), B.print(), setTimeout(function () { b.appendChild(a); r(h, function (a, b) { if (a.nodeType === 1) a.style.display = d[b] }); c.isPrinting = !1 }, 1E3) }, contextMenu: function (c, a, d, b, f, h, g) { var e = this, j = e.options.navigation, q = j.menuItemStyle, l = e.chartWidth, m = e.chartHeight, o = "cache-" + c, i = e[o], s = D(f, h), v, w, n; if (!i) e[o] = i = k("div", { className: c }, { position: "absolute", zIndex: 1E3, padding: s + "px" }, e.container), v = k("div", null, p({ MozBoxShadow: "3px 3px 10px #888", WebkitBoxShadow: "3px 3px 10px #888", boxShadow: "3px 3px 10px #888" }, j.menuStyle), i), w = function () { u(i, { display: "none" }); g && g.setState(0); e.openMenu = !1 }, t(i, "mouseleave", function () { n = setTimeout(w, 500) }), t(i, "mouseenter", function () { clearTimeout(n) }), t(document, "mouseup", function (a) { e.pointer.inClass(a.target, c) || w() }), r(a, function (a) { if (a) { var b = a.separator ? k("hr", null, null, v) : k("div", { onmouseover: function () { u(this, j.menuItemHoverStyle) }, onmouseout: function () { u(this, q) }, onclick: function () { w(); a.onclick.apply(e, arguments) }, innerHTML: a.text || e.options.lang[a.textKey] }, p({ cursor: "pointer" }, q), v); e.exportDivElements.push(b) } }), e.exportDivElements.push(v, i), e.exportMenuWidth = i.offsetWidth, e.exportMenuHeight = i.offsetHeight; a = { display: "block" }; d + e.exportMenuWidth > l ? a.right = l - d - f - s + "px" : a.left = d - s + "px"; b + h + e.exportMenuHeight > m && g.alignOptions.verticalAlign !== "top" ? a.bottom = m - b - s + "px" : a.top = b + h - s + "px"; u(i, a); e.openMenu = !0 }, addButton: function (c) { var a = this, d = a.renderer, b = o(a.options.navigation.buttonOptions, c), j = b.onclick, h = b.menuItems, g, e, k = { stroke: b.symbolStroke, fill: b.symbolFill }, q = b.symbolSize || 12; if (!a.btnCount) a.btnCount = 0; if (!a.exportDivElements) a.exportDivElements = [], a.exportSVGElements = []; if (b.enabled !== !1) { var l = b.theme, m = l.states, n = m && m.hover, m = m && m.select, i; delete l.states; j ? i = function () { j.apply(a, arguments) } : h && (i = function () { a.contextMenu(e.menuClassName, h, e.translateX, e.translateY, e.width, e.height, e); e.setState(2) }); b.text && b.symbol ? l.paddingLeft = f.pick(l.paddingLeft, 25) : b.text || p(l, { b.width, height: b.height, padding: 0 }); e = d.button(b.text, 0, 0, i, l, n, m).attr({ title: a.options.lang[b._titleKey], "stroke-linecap": "round" }); e.menuClassName = c.menuClassName || "highcharts-menu-" + a.btnCount++; b.symbol && (g = d.symbol(b.symbol, b.symbolX - q / 2, b.symbolY - q / 2, q, q).attr(p(k, { "stroke-width": b.symbolStrokeWidth || 1, zIndex: 1 })).add(e)); e.add().align(p(b, { e.width, x: f.pick(b.x, y) }), !0, "spacingBox"); y += (e.width + b.buttonSpacing) * (b.align === "right" ? -1 : 1); a.exportSVGElements.push(e, g) } }, destroyExport: function (c) { var c = c.target, a, d; for (a = 0; a < c.exportSVGElements.length; a++) if (d = c.exportSVGElements[a]) d.onclick = d.ontouchstart = null, c.exportSVGElements[a] = d.destroy(); for (a = 0; a < c.exportDivElements.length; a++) d = c.exportDivElements[a], C(d, "mouseleave"), c.exportDivElements[a] = d.onmouseout = d.onmouseover = d.ontouchstart = d.onclick = null, n(d) } }); F.menu = function (c, a, d, b) { return ["M", c, a + 2.5, "L", c + d, a + 2.5, "M", c, a + b / 2 + 0.5, "L", c + d, a + b / 2 + 0.5, "M", c, a + b - 1.5, "L", c + d, a + b - 1.5] }; A.prototype.callbacks.push(function (c) { var a, d = c.options.exporting, b = d.buttons; y = 0; if (d.enabled !== !1) { for (a in b) c.addButton(b[a]); t(c, "destroy", c.destroyExport) } }) })(Highcharts);
将x.exporting = {
url:"/OAMA/Count/Export"
上面代码是我在之前的项目写好的,highcharts 默认是url:"http://export.highcharts.com/"
将url改为
url:"/Home/Export"
其实exporting.src.js 里的内容是源文件的 可以直接引用这个文件,在这个js文件里改动
保存-编译-运行
成功导出~
