Luca Canali on 26 May 2016
Topic: In this post you will find a short discussion and pointers to the code of a few sample scripts that I have written using Linux BPF/bcc and uprobes for Oracle tracing.
Previous work and motivations
Tools for dynamic tracing are very useful for troubleshooting and internals investigations of Oracle workloads. Dynamic tracing probes on the OS/kernel, can be used to measure the details for I/O latency for example. Moreover probes on the Oracle userspace functions can be be used to complement Oracle instrumentation and probe deeper into the internals of the Oracle engine, when needed. For example in a work done in collaboration with Frits Hoogland(link is external) we have investigated how to link Oracle wait event interface with tools able to probe the userspace, such as gdb and dynamic tracing tools as DTrace, SystemTap and Perf. More details and examples on this topic can be found in previous work: Modern Linux Tools for Oracle Troubleshooting (presentation at UKOUG Tech14), Life of an Oracle I/O: Tracing Logical and Physical I/O with SystemTap(link is external), Linux Perf Probes for Oracle Tracing(link is external), Flame Graphs for Oracle(link is external).
What's new with BPF/bcc
BPF together with his frontend bcc(link is external) are new and exciting technologies in the Linux dynamic tracing ecosystem. If you are not familiar with them, you can get up to speed using the excellent material in Brendan Gregg's blog(link is external). While the tools are still in development as I write this, a large amount of important features are already available starting from kernel 4.5, notably the support for uprobes that I have used in the scripts discussed later in this post.
I have started experimenting with porting a few probes for the Oracle userspace that I had written using SystemTap and discussed in this blog. While the language/syntax is completely different between SystemTap and BPF/bcc, porting the probes has turned out to be relatively straightforward. The work has been made substantially easier by the availability of a large selection of well-written and documented scripts in the tools directory of bcc(link is external). At present writing BPF/bcc scripts is a mixture of coding in Python and C, which feels to me both familiar and at the same time strangely low-level compared to the more mature environments for example of DTrace and SystemTap.
The example scripts that I have written using BPF/bcc are on Github(link is external). Here is a list with comments:
|
Script name |
Short description |
|---|---|
|
Tracing of Oracle SQL parsing. This script traces SQL hard parsing on Oracle binaries hooking on the Oracle function "opiprs" and reads from function arguments (CPU registers) and from process memory. |
|
|
Tracing of Oracle wait events. This script traces Oracle sessions by hooking on the functions "kskthewt" and "kews_update_wait_time" and reads from function arguments (CPU registers). |
|
|
Logical IO latency histograms. This script measures the latency between call and return time for the Oracle function "kcbgtcr", which is an important part of the logical IO processing for consistent reads. |
|
|
Wait event latency histograms. This script traces Oracle sessions by hooking on the functions "kskthewt" and "kews_update_wait_time" and reads from function arguments (CPU registers). BPF computes the latency histogram for the wait events and the script prints the values on stdout. |
An example of the usage of ora_wait_histogram.py to measure and display wait event latency:
# stdbuf -oL ./ora_wait_histogram.py 10 10|sed -e 's/event# = /event#=/g' -f eventsname.sed
Start tracing oracle wait events... Hit Ctrl-C to end.
event=db file sequential read
wait time, microsec : count distribution
0 -> 1 : 0 | |
2 -> 3 : 0 | |
4 -> 7 : 0 | |
8 -> 15 : 0 | |
16 -> 31 : 0 | |
32 -> 63 : 0 | |
64 -> 127 : 25 | |
128 -> 255 : 24521 |******************** |
256 -> 511 : 46788 |****************************************|
512 -> 1023 : 12169 |********** |
1024 -> 2047 : 1132 | |
2048 -> 4095 : 660 | |
4096 -> 8191 : 248 | |
8192 -> 16383 : 29 | |
Latency heat maps to display histograms collected with BPF/bcc
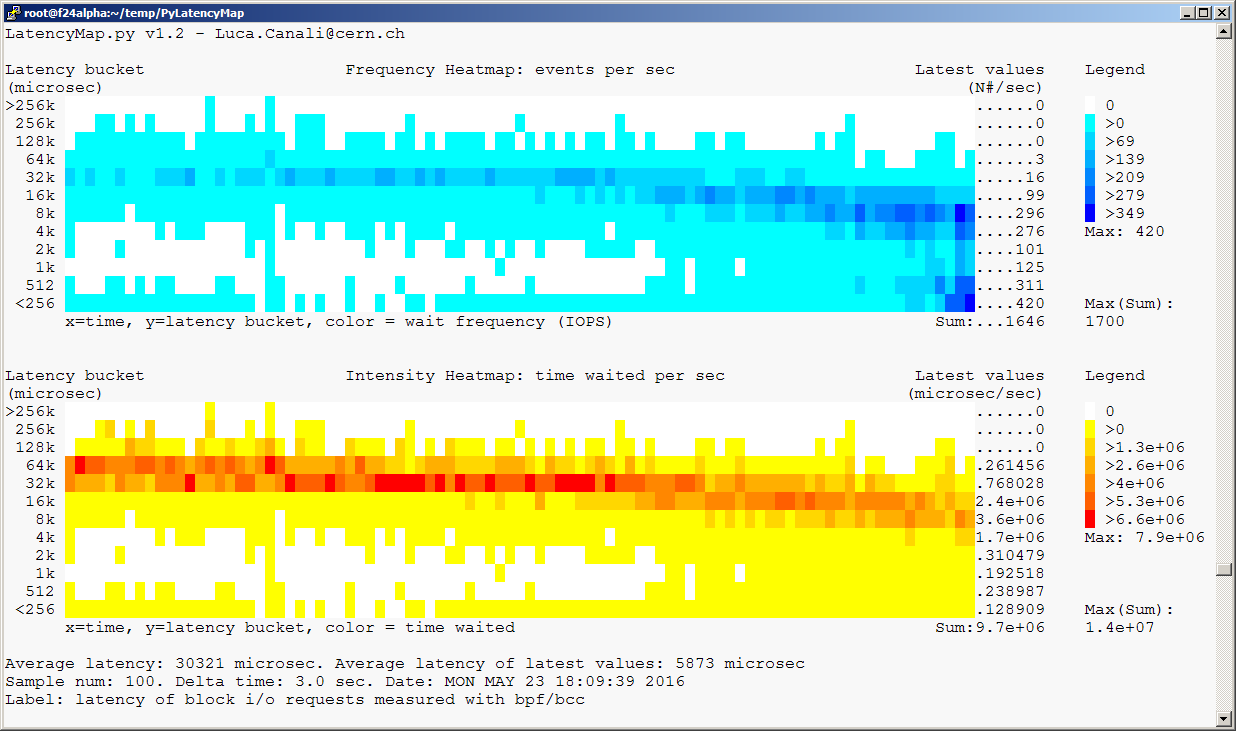
PyLatencyMap (link is external)is a command-line tool for visualizing latency histograms using heat maps on terminal graphics, using ANSI escape codes. PyLatencyMap can be used to investigate I/O performance for random I/O, especially suited for the cases of multiple modes of response time from the storage (SSD cache, HDD, latency outliers). The original idea for PyLatencyMap comes from the work of Brendan Gregg(link is external) on latency heat maps. I have added to the PyLatencyMap repository(link is external) a modified version of the biolatency.py(link is external) script to measure I/O latency histograms: this is the link to the script pylatencymap_biolatency.py(link is external) and an example of heat maps generated with PyLatencyMap with the script Example11_BPF-bcc_blockIO_latency.sh(link is external):
The test workload has been generated using Kevin Closson's SLOB(link is external). Additional references with a more detailed discussion of the topic of testing Oracle I/O with SLOB and measuring latency heat maps are:
Heat Map Visualization of I/O Latency with SystemTap and PyLatencyMap(link is external) and OraLatencyMap v1.1 and Testing I/O with SLOB 2(link is external).
Notes on the test environment
The scripts discussed in this post have been developed on Fedora 24 (alpha) running Linux kernel version 4.6 (using the rawhide kernel) and have been tested on workloads generated using Oracle version 11.2.0.4. This is not an Oracle-supported configuration and the scripts are intended mainly as a demonstration of the technology and for learning purposes.
Here are some pointers on the steps I used to setup a lab environment for testing:
- Download Fedora server from https://getfedora.org/en/server/(link is external) (version 24 beta, as I write this).
- Installed Fedora, for example on a VM with VirtualBox(link is external)
- Run "sudo dnf update" to get the latest kernel and packages
- Get kernel-devel with "sudo dnf install kernel-devel"
- Follow the installation instructions for bcc on Fedora from https://github.com/iovisor/bcc/blob/master/INSTALL.md(link is external)
Conclusions
BPF with its bcc frontend are new and powerful tools for dynamic tracing for Linux. A discussion of the merits and shortfalls of BPF/bcc vs other existing solutions in the Linux dynamic tracing ecosystem is beyond the scope of this post. What you can find in this post are a few example scripts that I have written for tracing Oracle using BPF/bcc anduprobes and an additional script for integrating BPF/bcc with PyLatencyMap, which provides visualization as heat maps of the histograms generated using BPF/bcc.
Although the BPF/bcc environment is currently under evolution, it appears already a very useful addition to the toolbox for troubleshooting and performance investigations of Linux workloads. A set of example scripts/tools that come with the bcc repository are of great help for getting started both with using BPF/bcc and with writing new scripts. BPF/bcc can only run on relatively new kernels (as I write this, I have tested the scripts discussed in this post on kernel version 4.6) and this is an obstacle for its adoption in many environments, at least in the short term.
Credits and acknowledgements
Many of the original ideas and tools discussed here are inspired or directly derived from the awesome published work of Brendan Gregg(link is external).
Many thanks also to the development teams of BPF and bcc(link is external) for providing and supporting this new powerful tools. In particular thanks to Brenden Blanco(link is external) for his work on uprobes for bcc and for his support on issue #478(link is external).
The work of investigating Oracle userspace with dynamic tracing tools has been done in collaboration with Frits Hoogland(link is external).