个人笔记总结,可读性不高。只为自己总结用。怕日后忘记。
这里用到了tushare,pandas等python组件。
pyechart的案例
c = (
Bar()
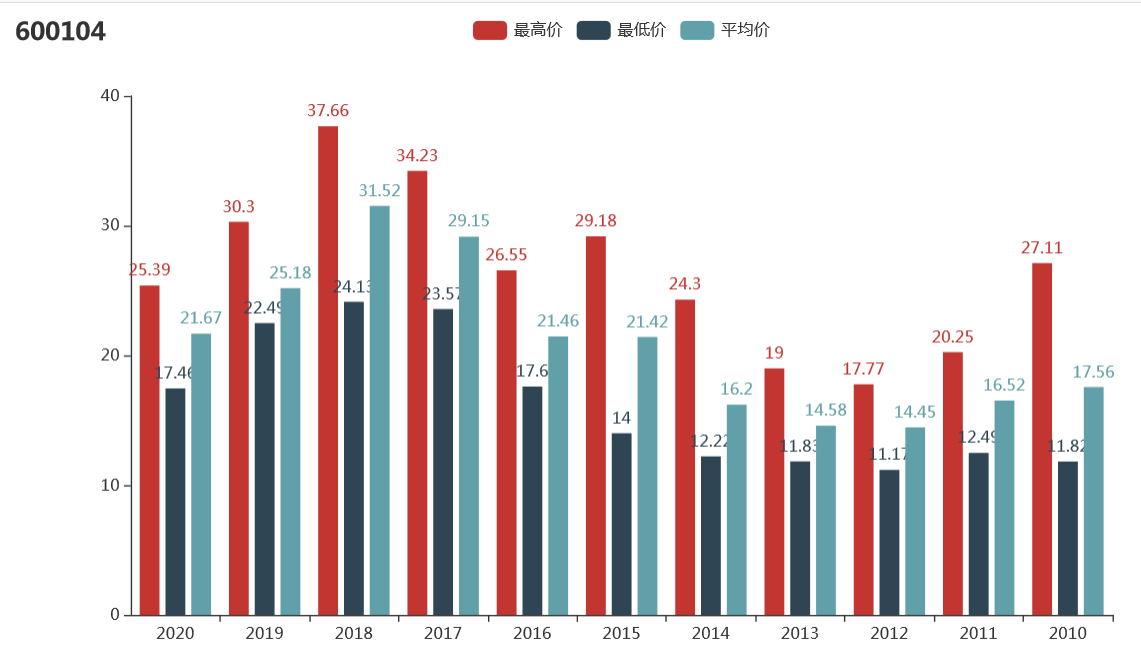
.add_xaxis(["2020","2019","2018","2017","2016","2015","2014","2013","2012","2011","2010"])
.add_yaxis("最高价", df2['high'].tolist())
.add_yaxis("最低价", df2['low'].tolist())
.add_yaxis("平均价", df2['mean'].tolist())
.set_global_opts(title_opts=opts.TitleOpts(title=stock_code))
)
return c
定义了get_price函数
def get_price(stock_code):
    stock_price = ts.get_hist_data(stock_code, ktype='M')
    stock_price.to_csv('stock_price.csv')
    price_online = pd.read_csv('stock_price.csv', dtype={'code': np.str})
    price_online_bf =price_online.loc[(price_online['open'] != 0),['date','open','high','close','low']]
    price_online_bf.to_csv('stock_price_online.csv')
    df = pd.read_csv('stock_price_online.csv')
#    print(df.head(2))
    df['date'] = pd.to_datetime(df['date'])
    df = df.set_index('date') # 将date设置为index
    date_array=('2020','2019','2018','2017','2016','2015','2014','2013','2012','2011','2010')
    date_list=['2020','2019','2018','2017','2016','2015','2014','2013','2012','2011','2010']
    min_array_list=[]
    max_array_list=[]
    mean_array_list=[]
    for each in date_array:
#        print(df[each])
        price_min=df[each].low.min()
        min_array_list.append(price_min)
#        print(price_min)
        price_max=df[each].high.max()
#        print(price_max)
        max_array_list.append(price_max)
        price_mean=df[each].close.mean()
#        print(round(price_mean,2))
        mean_array_list.append(round(price_mean,2))
#        print(min_array_list)
    own_dataframe={'date':date_list,'high':max_array_list,'low':min_array_list,'mean':mean_array_list}
    df2=pd.DataFrame(own_dataframe)

    c = (
           Bar()
            .add_xaxis(["2020","2019","2018","2017","2016","2015","2014","2013","2012","2011","2010"])
            .add_yaxis("最高价", df2['high'].tolist())
            .add_yaxis("最低价", df2['low'].tolist())
            .add_yaxis("平均价", df2['mean'].tolist())
            .set_global_opts(title_opts=opts.TitleOpts(title=stock_code))
    )
    return c
flask的视图函数调用
@main.route('/stock/<stock_code>')
def stocklist20(stock_code):
    c = get_price(stock_code)
    return Markup(c.render_embed())
运行:
flask run -h '0.0.0.0' -p 9000
通过调用地址:http://172.30.200.252:9000/stock/600104,得到以下数据
演示效果: