SSB-AM
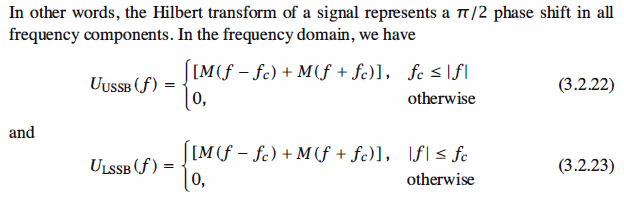
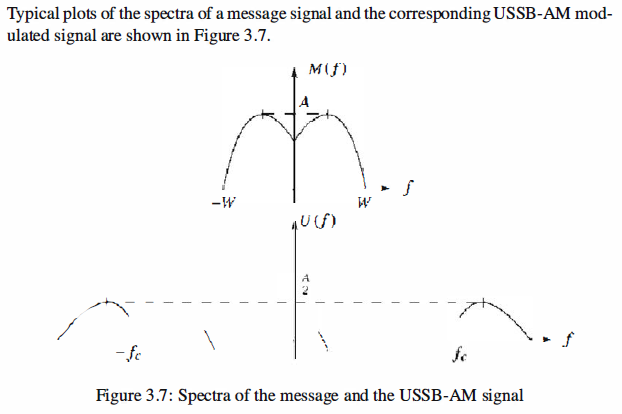
SSB-AM is derived from DSB-AM by eliminating one of the sidebands. Therefore,
it occupies half the bandwidth of DSB-AM. Depending on the sideband that remains,
either the upper or the lower sideband, there exist two types of SSB-AM: Upper SingleSideband
AM (USSB-AM) and Lower Single-Sideband AM (LSSB-AM).
The time representation for these signals is given by

Matlab Coding

Solution
 1 % MATLAB script for Illustrative Problem 3.4.
 2 % Demonstration script for LSSB-AM modulation. The message signal
 3 % is +1 for 0 < t < t0/3, -2 for t0/3 < t < 2t0/3, and zero otherwise.
 4 echo on
 5 t0=.15;                                 % signal duration
 6 ts=0.001;                               % sampling interval
 7 fc=250;                                 % carrier frequency
 8 snr=10;                                 % SNR in dB (logarithmic)
 9 fs=1/ts;                                % sampling frequency
10 df=0.25;                                % desired freq. resolution
11 t=[0:ts:t0];                            % time vector
12 snr_lin=10^(snr/10);                    % SNR
13 % the message vector
14 m=[ones(1,t0/(3*ts)),-2*ones(1,t0/(3*ts)),zeros(1,t0/(3*ts)+1)];
15 c=cos(2*pi*fc.*t);                      % carrier vector
16 udsb=m.*c;                              % DSB modulated signal
17 [UDSB,udssb,df1]=fftseq(udsb,ts,df);    % Fourier transform
18 UDSB=UDSB/fs;                           % scaling
19 f=[0:df1:df1*(length(udssb)-1)]-fs/2;   % frequency vector
20 n2=ceil(fc/df1);                        % location of carrier in freq. vector

21 % Remove the upper sideband from DSB.
22 UDSB(n2:length(UDSB)-n2)=zeros(size(UDSB(n2:length(UDSB)-n2)));
23 ULSSB=UDSB;                             % Generate LSSB-AM spectrum.
24 [M,m,df1]=fftseq(m,ts,df);              % Fourier transform
25 M=M/fs;                                 % scaling
26 u=real(ifft(ULSSB))*fs;                 % Generate LSSB signal from spectrum.
27 signal_power=spower(udsb(1:length(t)))/2;
28 %                                       % Compute signal power.
29 noise_power=signal_power/snr_lin;       % Compute noise power.
30 noise_std=sqrt(noise_power);            % Compute noise standard deviation.
31 noise=noise_std*randn(1,length(u));     % Generate noise vector.
32 r=u+noise;                              % Add the signal to noise.
33 [R,r,df1]=fftseq(r,ts,df);              % Fourier transform
34 R=R/fs;                                 % scaling
35 pause  % Press a key to show the modulated signal power.
36 signal_power
37 pause  % Press any key to see a plot of the message signal.
38 clf
39 subplot(2,1,1)
40 plot(t,m(1:length(t)))
41 axis([0,0.15,-2.1,2.1])
42 xlabel('Time')
43 title('The message signal')
44 pause  % Press any key to see a plot of the carrier.
45 subplot(2,1,2)
46 plot(t,c(1:length(t)))
47 xlabel('Time')
48 title('The carrier')
49 pause  % Press any key to see a plot of the modulated signal and its spectrum.
50 clf
51 subplot(2,1,1)
52 plot([0:ts:ts*(length(u)-1)/8],u(1:length(u)/8))
53 xlabel('Time')
54 title('The LSSB-AM modulated signal')
55 subplot(2,1,2)
56 plot(f,abs(fftshift(ULSSB)))
57 xlabel('Frequency')
58 title('Spectrum of the LSSB-AM modulated signal')
59 pause   % Press any key to see the spectra of the message and the modulated signals.
60 clf
61 subplot(2,1,1)
62 plot(f,abs(fftshift(M)))
63 xlabel('Frequency')
64 title('Spectrum of the message signal')
65 subplot(2,1,2)
66 plot(f,abs(fftshift(ULSSB)))
67 xlabel('Frequency')
68 title('Spectrum of the LSSB-AM modulated signal')
69 pause  % Press any key to see a noise sample.
70 subplot(2,1,1)
71 plot(t,noise(1:length(t)))
72 title('Noise sample')
73 xlabel('Time')
74 pause  % Press a key to see the modulated signal and noise.
75 subplot(2,1,2)
76 plot(t,r(1:length(t)))
77 title('Modulated signal and noise')
78 xlabel('Time')
79 subplot(2,1,1)
80 pause % Press any key to see the spectrum of the modulated signal.
81 plot(f,abs(fftshift(ULSSB)))
82 title('Modulated signal spectrum')
83 xlabel('Frequency')
84 subplot(2,1,2)
85 pause  % Press a key to see the modulated signal noise in freq. domain.
86 plot(f,abs(fftshift(R)))
87 title('Modulated signal noise spectrum')
88 xlabel('Frequency')
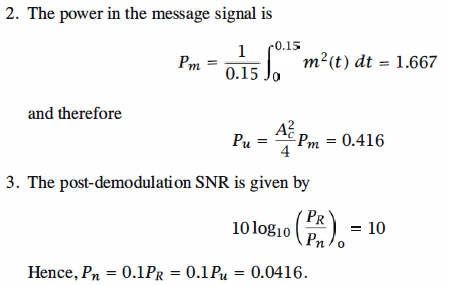
The modulated signal power
signal_power =
0.4139
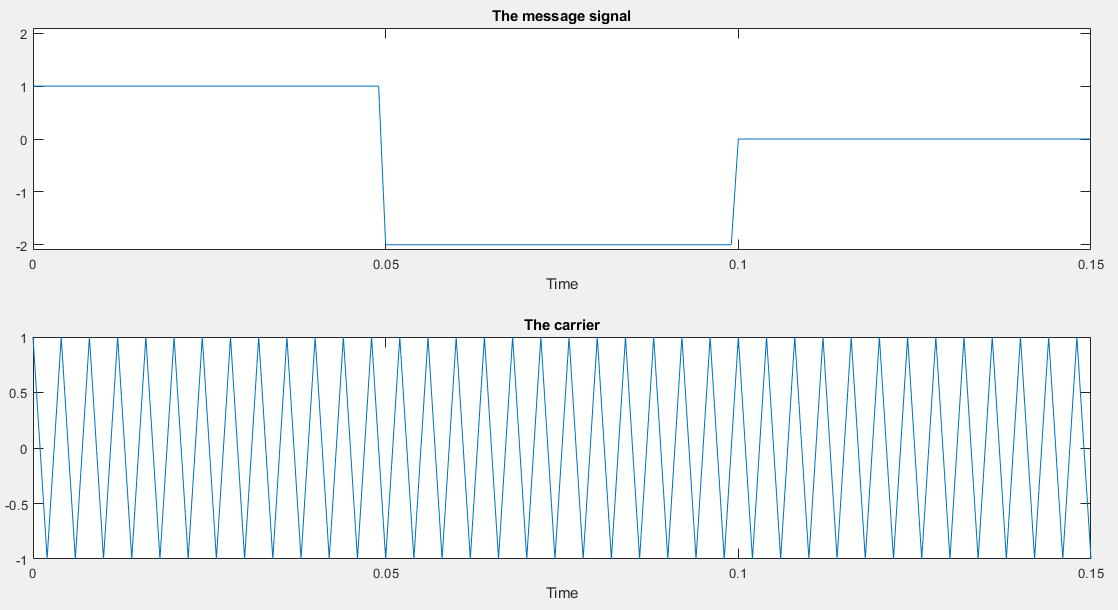
The message signal, and the carrier
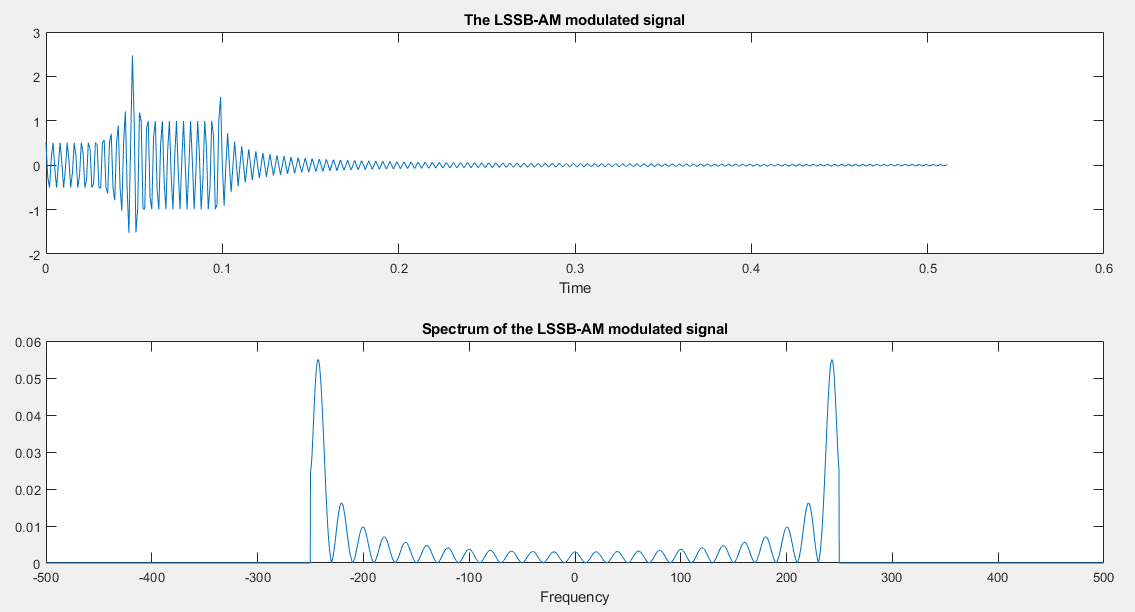
The modulated signal and its spectrum
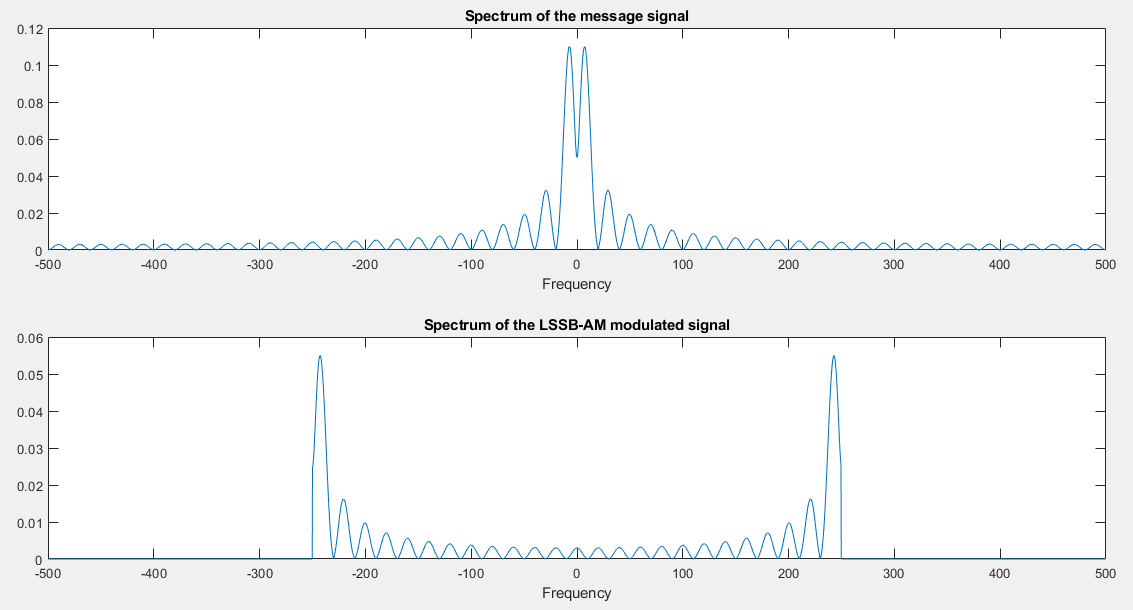
The spectra of the message and the modulated signals
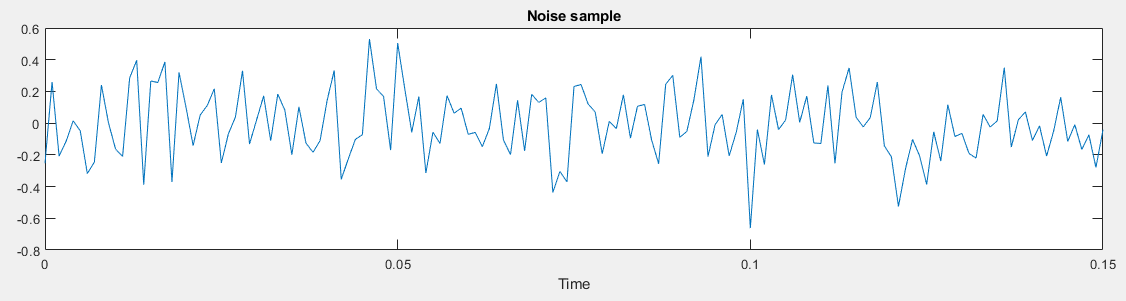
The noise sample
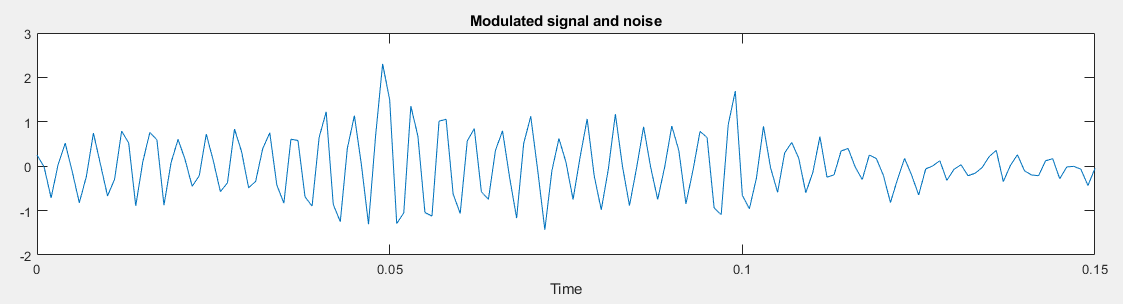
The modulated signal and noise
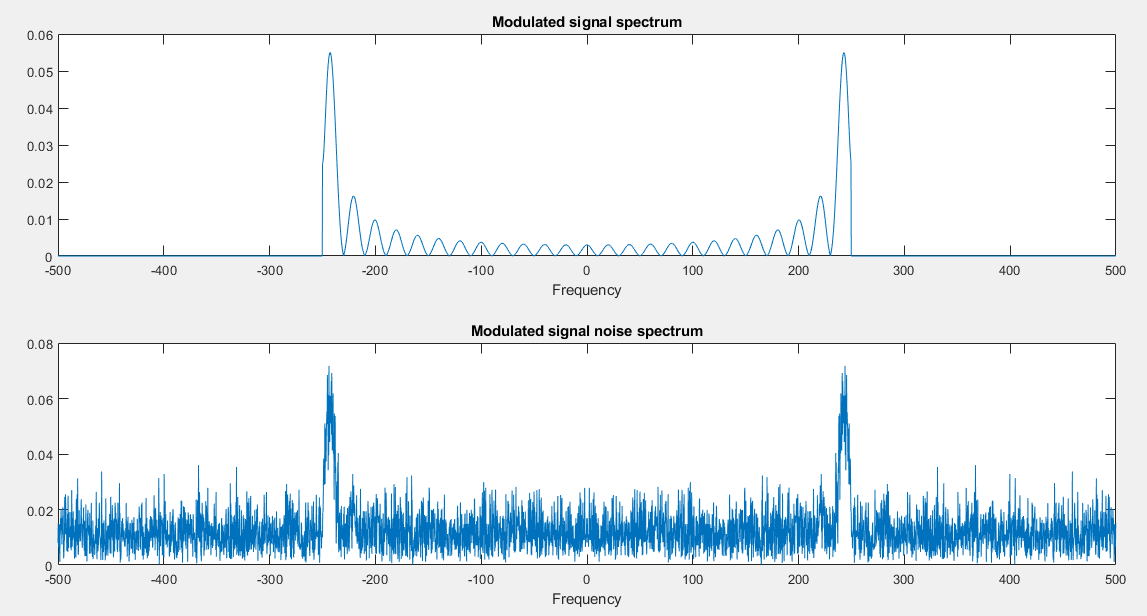
The spectrum of the modulated signal and the modulated signal noise in frequency domain
Reference,
1. <<Contemporary Communication System using MATLAB>> - John G. Proakis