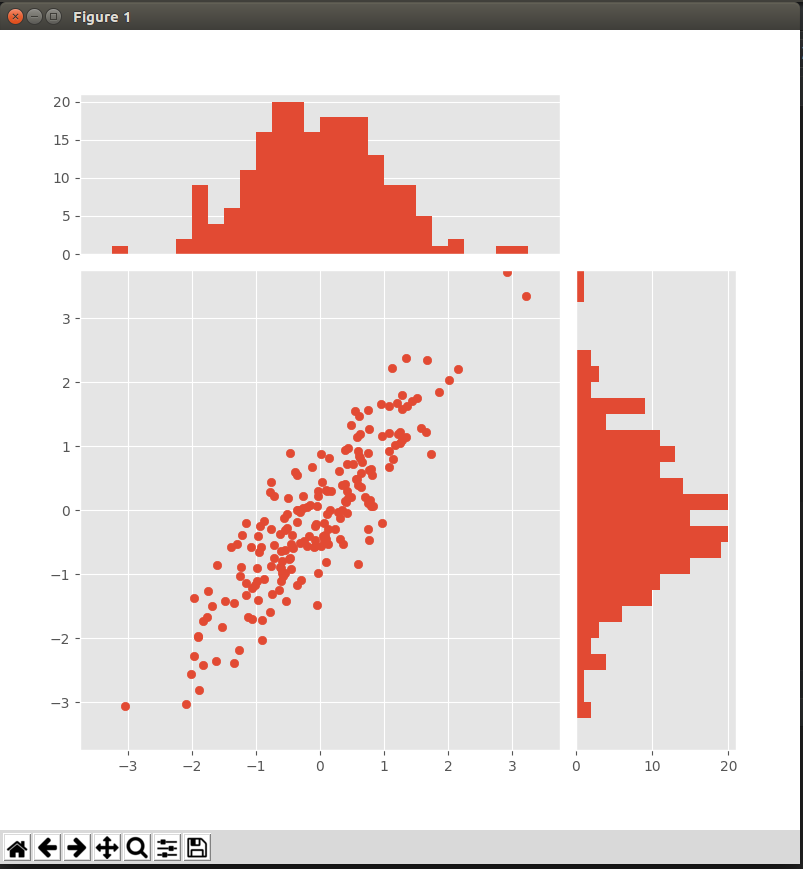
# coding:utf-8
from matplotlib import pyplot as plt
import numpy as np

plt.style.use('ggplot')

x = np.random.randn(200)
y = x + np.random.randn(200) * 0.5

# 确定图的位置
margin_border = 0.1
width = 0.6
margin_between = 0.02
height = 0.2

left_s = margin_border
bottom_s = margin_border
height_s = width
width_s = width

left_x = margin_border
bottom_x = margin_border + width + margin_between
height_x = height
width_x = width

left_y = margin_border + width + margin_between
bottom_y = margin_border
height_y = width
width_y = height

plt.figure(1, figsize=(8, 8))
rect_s = [left_s, bottom_s, width_s, height_s]
rect_x = [left_x, bottom_x, width_x, height_x]
rect_y = [left_y, bottom_y, width_y, height_y]

axScatter = plt.axes(rect_s)
axHisX = plt.axes(rect_x)
axHisY = plt.axes(rect_y)

axHisX.set_xticks([])
axHisY.set_yticks([])

# 绘图
axScatter.scatter(x, y)

bin_width = 0.25
xymax = np.max([np.max(np.fabs(x)), np.max(np.fabs(y))])
lim = int(xymax / bin_width + 1) * bin_width

axScatter.set_xlim(-lim, lim)
axScatter.set_ylim(-lim, lim)

bins = np.arange(-lim, lim + bin_width, bin_width)

axHisX.hist(x, bins=bins)
axHisY.hist(y, bins=bins, orientation='horizontal')

# 同步条形图与散点图的横纵坐标
axHisX.set_xlim(axScatter.get_xlim())
axHisY.set_ylim(axScatter.get_ylim())

plt.show()