Statistical Process Control 简介
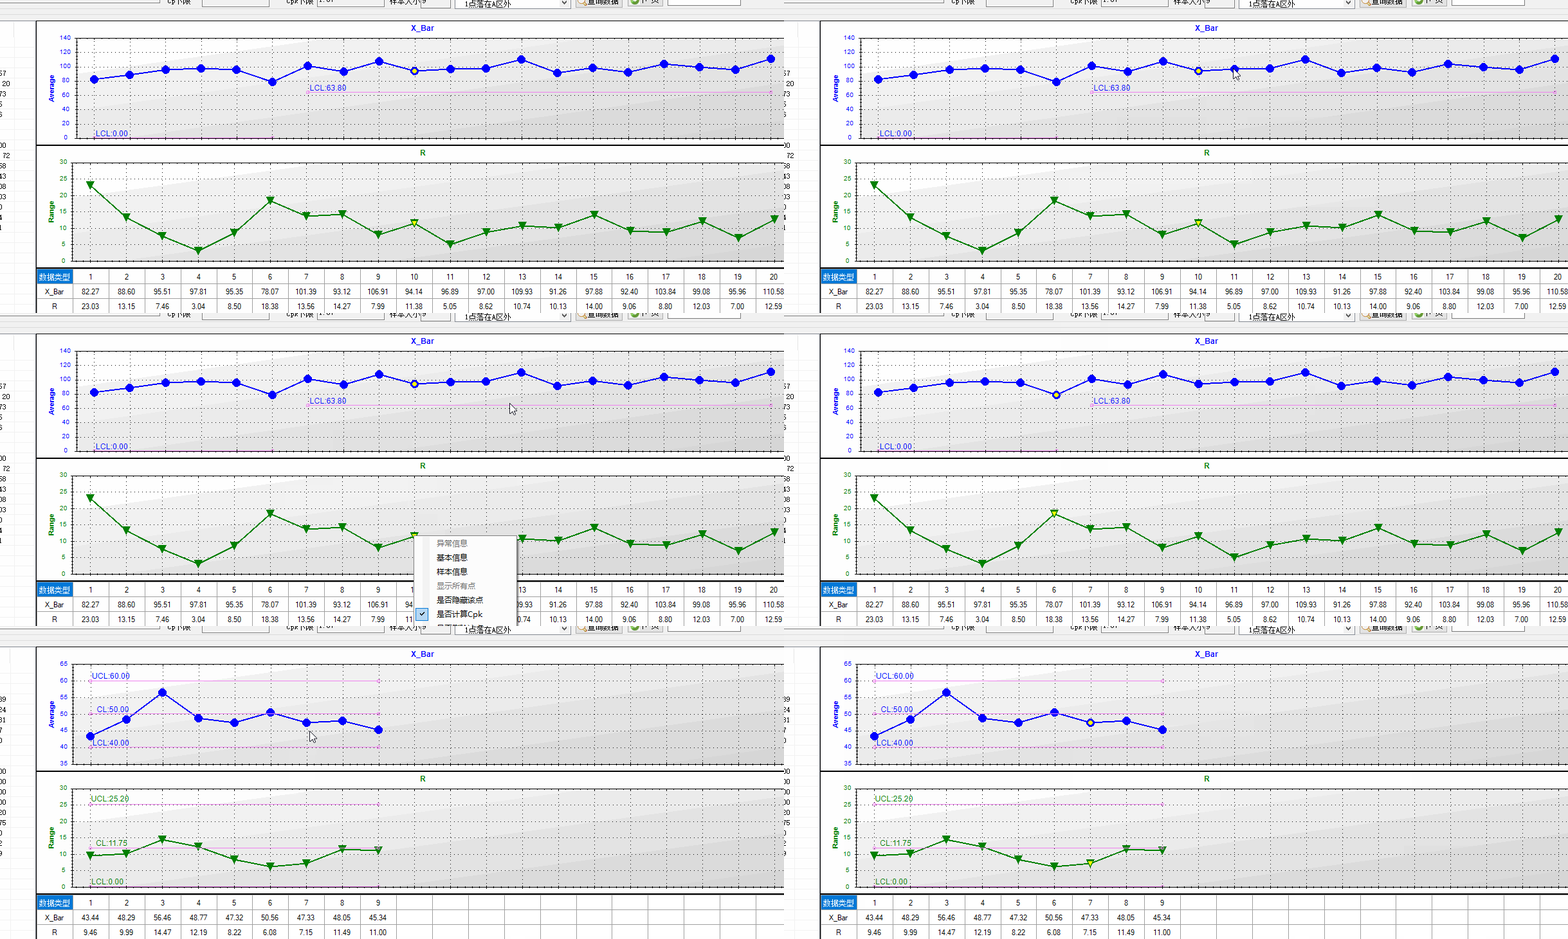
统计过程控制(Statistical Process Control)是一种借助数理统计方法的过程控制工具。它对生产过程进行分析评价,根据反馈信息及时发现系统性因素出现的征兆,并采取措施消除其影响,使过程维持在仅受随机性因素影响的受控状态,以达到控制质量的目的。
在企业的生产制造过程中,我们常常需要采集生产数据,然后对数据进行处理,最后对处理好的数据、调度指令或者决策以报表和数据大屏等方式进行呈现,给与领导层合理科学的决策建议。
本项目主要采用Windows 10 + Visual Studio 2019 + Windows窗体应用(.Net Framework)实现六西格玛模式数据决策和Chart报表模块展示,主要用于继续的学习和研究。
六西格玛核心算法
算法参考公式 点我下载 ,利用算法对数据进行处理后,结合Chart模块即可实现Chart报表的展示。
Chart模块核心代码

 1 //定义图表区域
 2             this.chartMain.ChartAreas.Clear();
 3             ChartArea chartArea1 = new ChartArea("C1");
 4             this.chartMain.ChartAreas.Add(chartArea1);
 5             //定义存储和显示点的容器
 6             this.chartMain.Series.Clear();
 7             Series series1 = new Series("S1");
 8             series1.ChartArea = "C1";
 9             this.chartMain.Series.Add(series1);
10             //设置图表显示样式
11             this.chartMain.ChartAreas[0].AxisY.Minimum = 0;
12             this.chartMain.ChartAreas[0].AxisY.Maximum = 100;
13             this.chartMain.ChartAreas[0].AxisX.Interval = 5;
14             this.chartMain.ChartAreas[0].AxisX.MajorGrid.LineColor = System.Drawing.Color.Silver;
15             this.chartMain.ChartAreas[0].AxisY.MajorGrid.LineColor = System.Drawing.Color.Silver;
16             //设置标题
17             this.chartMain.Titles.Clear();
18             this.chartMain.Titles.Add("S01");
19             this.chartMain.Titles[0].Text = "XXX显示";
20             this.chartMain.Titles[0].ForeColor = Color.Green;
21             this.chartMain.Titles[0].Font = new System.Drawing.Font("Microsoft Sans Serif", 12F);
22             //设置图表显示样式
23             this.chartMain.Series[0].Color = Color.Red;
24             if (this.cmbChartType.Text.ToString() == "折线图")
25             {
26                 this.chartMain.Titles[0].Text = string.Format("SPC模块-[{0}]功能测试", "折线图");
27                 this.chartMain.Series[0].ChartType = SeriesChartType.Line;
28             }
29             else if (this.cmbChartType.Text.ToString() == "波形图")
30             {
31                 this.chartMain.Titles[0].Text = string.Format("SPC模块-[{0}]功能测试", "波形图");
32                 this.chartMain.Series[0].ChartType = SeriesChartType.Spline;
33             }
34             this.chartMain.Series[0].Points.Clear();
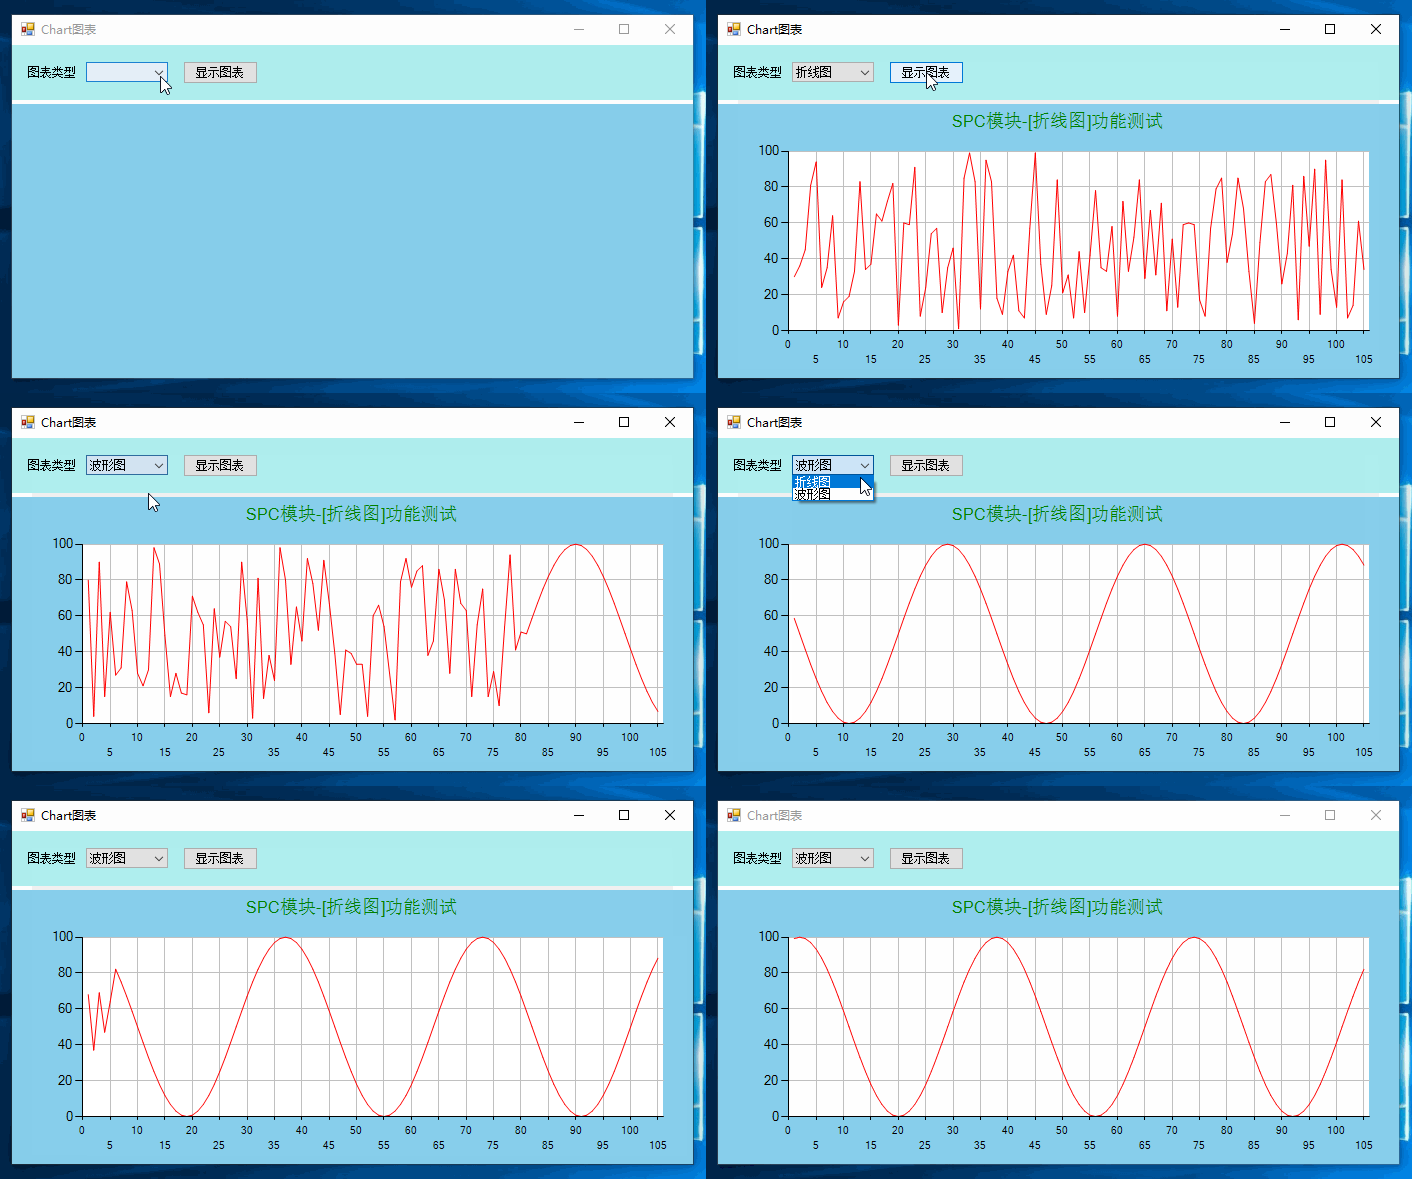
实现效果


作者:Jeremy.Wu
出处:https://www.cnblogs.com/jeremywucnblog/
本文版权归作者和博客园共有,欢迎转载,但未经作者同意必须保留此段声明,且在文章页面明显位置给出原文连接,否则保留追究法律责任的权利。
