问题描述
1、Python开发的程序在使用过程中很慢,想确定下是哪段代码比较慢;
2、Python开发的程序在使用过程中占用内存很大,想确定下是哪段代码引起的;
解决方案
使用profile分析分析cpu使用情况
可以使用profile和cProfile对python程序进行分析,这里主要记录下cProfile的使用,profile参考cProfile即可。
#slots_test.py
class Foobar(object):
    __slots__=('x')
    def __init__(self, x):
        self.x = x


def main():
    f = [Foobar(42) for i in range(1000000)]

if __name__ == "__main__":
    main()
1.简单查看
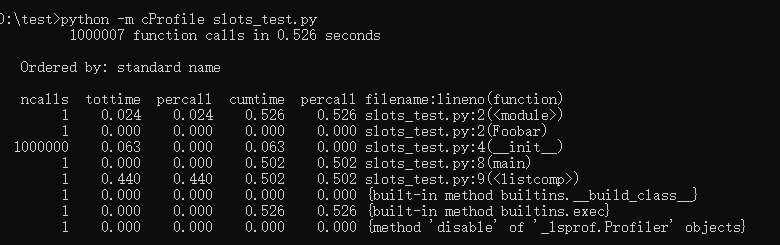
python -m cProfile slots_test.py
2.不修改程序
python -m cProfile -o test1.out slots_test.py
python -c "import pstats; p=pstats.Stats('test1.out'); p.print_stats()"
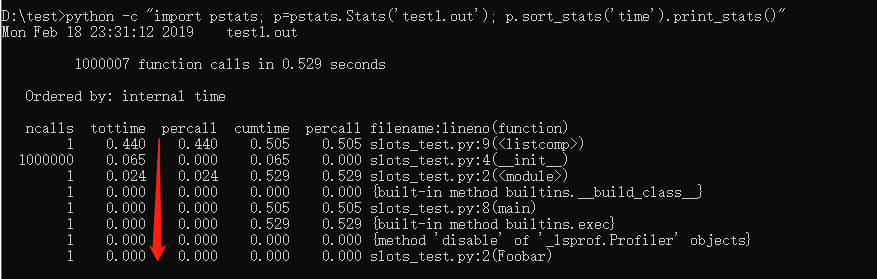
查看排序后的结果:
python -c "import pstats; p=pstats.Stats('test1.out'); p.sort_stats('time').print_stats()"
结果说明
ncalls : 函数的被调用次数
tottime :函数总计运行时间,除去函数中调用的函数运行时间
percall :函数运行一次的平均时间,等于tottime/ncalls
cumtime :函数总计运行时间,含调用的函数运行时间
percall :函数运行一次的平均时间,等于cumtime/ncalls
filename:lineno(function) 函数所在的文件名,函数的行号,函数名
使用memory_profiler分析内存使用情况
需要安装memory_profiler :
pip install psutil
pip install memory_profiler
1.不导入模块
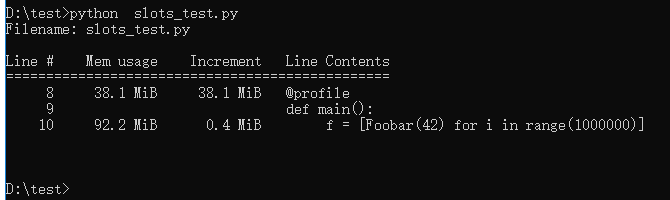
python -m memory_profiler slots_test.py
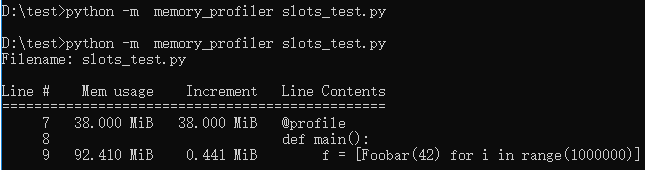
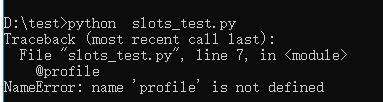
不加 -m memory_profiler会报错
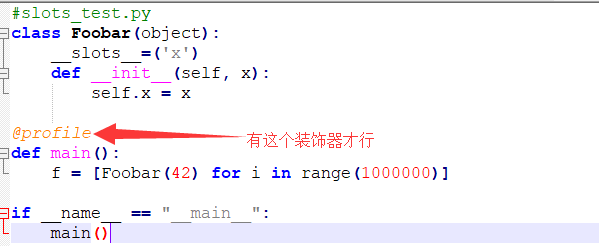
2.导入模块
#slots_test.py
from memory_profiler import profile

class Foobar(object):
    __slots__=('x')
    def __init__(self, x):
        self.x = x

@profile
def main():
    f = [Foobar(42) for i in range(1000000)]

if __name__ == "__main__":
    main()
python slots_test.py