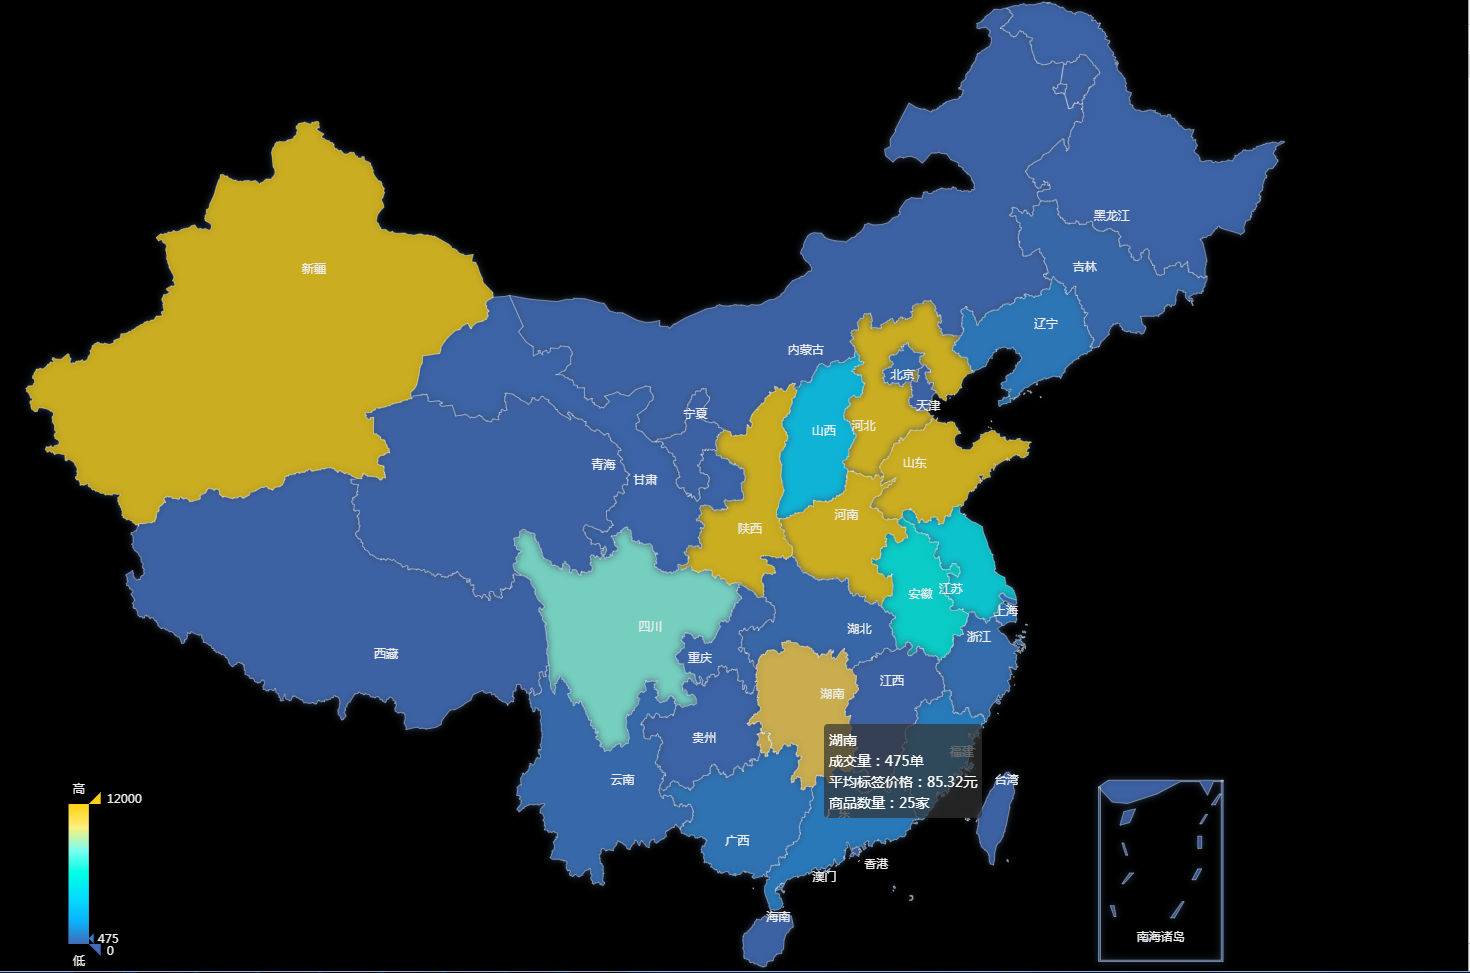
以前做得中国地图展示各省相应指标数据,效果如图:

核心文件两个Echarts.js是肯定需要的,还有一个echarts.china.js,gittub上有,大家可以去下载。
内有相应的数据格式,根据大家的实际用途自己修改吧。
据图详解都已注释形式写在下面的代码里了,需要大家引入相关的文件哦。其实没什么难的,看看文档和配置手册就差不多可以上手了。
<!DOCTYPE html>
<html lang="en">
<head>
  <meta charset="UTF-8">
  <meta name="viewport" content="width=device-width, initial-scale=1.0">
  <meta http-equiv="X-UA-Compatible" content="ie=edge">
  <title>Document</title>
  <style>
    html,body,.EchartsBox{
      width: 100%;
      height: 100%;
      margin: 0;
      padding: 0px;
      background-color: black
    }
  </style>
</head>
<body>
    <div class="EchartsBox" id="map"></div>
</body>
<script src="../echarts.js"></script>
<script src="./echarts.china.js"></script>
<script src="../../jquery.min.js"></script>
<script>
  $(function(){
    //数据
    var resultData=[{city: "山东", deal: 24583, count: 303, price: 54.22},
                {city: "福建", deal: 461, count: 45, price: 58.85},
                {city: "山东", deal: 24583, count: 303, price: 54.22},
                {city: "福建", deal: 461, count: 45, price: 58.85},
                {city: "河北", deal: 55977, count: 217, price: 30.88},
                {city: "河南", deal: 45923, count: 158, price: 43.35},
                {city: "重庆", deal: 124, count: 30, price: 45.86},
                {city: "湖北", deal: 181, count: 38, price: 39.97},
                {city: "湖南", deal: 475, count: 25, price: 85.32},
                {city: "江西", deal: 3, count: 12, price: 53.49},
                {city: "海南", deal: 1, count: 2, price: 23.35},
                {city: "黑龙江", deal: 46, count: 17, price: 55.42},
                {city: "天津", deal: 12, count: 7, price: 29.21},
                {city: "贵州", deal: 63, count: 14, price: 36.13},
                {city: "陕西", deal: 14328, count: 182, price: 41.89},
                {city: "新疆", deal: 28160, count: 128, price: 94.03},
                {city: "江苏", deal: 4997, count: 78, price: 48.02},
                {city: "安徽", deal: 5704, count: 153, price: 42.75},
                {city: "西藏", deal: 0, count: 0, price: 0},
                {city: "吉林", deal: 200, count: 30, price: 37.87},
                {city: "上海", deal: 635, count: 81, price: 62.96},
                {city: "山西", deal: 3810, count: 123, price: 66.14},
                {city: "甘肃", deal: 52, count: 32, price: 110.17},
                {city: "宁夏", deal: 0, count: 0, price: 0},
                {city: "四川", deal: 8308, count: 134, price: 42.89},
                {city: "浙江", deal: 365, count: 85, price: 57.07},
                {city: "广西", deal: 627, count: 49, price: 42.8},
                {city: "云南", deal: 250, count: 33, price: 41.58},
                {city: "内蒙古", deal: 0, count: 1, price: 6.5},
                {city: "辽宁", deal: 749, count: 178, price: 61.65},
                {city: "广东", deal: 860, count: 93, price: 61.85},
                {city: "青海", deal: 0, count: 0, price: 0},
                {city: "北京", deal: 330, count: 46, price: 56.85}];
            var seriesData = [];
            // 指定 visualMapContinuous 组件的允许的最大值
            var max = 12000;

            for(var i=0;i<resultData.length;i++){
                    seriesData.push({
                        name:resultData[i].city ,
                        value: +(resultData[i].deal),
                        price: (+resultData[i].price).toFixed(2),
                        amount: +(resultData[i].count)
                })
            }

            var option = {
                tooltip: {//鼠标一上去的信息框
                    trigger: 'item'
                },

                visualMap: {//visualMap 是视觉映射组件,用于进行『视觉编码』,也就是将数据映射到视觉元素(视觉通道)。
                    show: true,//是否显示组件
                    max: max,//指定 visualMapContinuous 组件的允许的最大值
                    left: '5%',
                    top: 'bottom',
                    bottom:'5%',
                    text: ['高', '低'],//两端的文本,如 ['High', 'Low']
                    calculable: true,//是否显示拖拽用的手柄(手柄能拖拽调整选中范围)。
                    inRange: {//定义 在选中范围中 的视觉元素。
                        color: [ '#416cbb' ,'#00b4ff', '#00deff' ,'#00ffe4', '#79fff1', '#fff17b', '#ffd200'],//图元的颜色。
                    },
                    textStyle: {//设置文字颜色(Demo左下组件)
                        color: '#eee'
                    }
                },
                // 地图配置
                geo: {
                    map: 'china',//地图类型
                    zoom: 1.24,//当前视角的缩放比例。(理解为地图放大缩小)
                    roam: false,//是否开启鼠标缩放和平移漫游。默认不开启。如果只想要开启缩放或者平移,可以设置成 'scale' 或者 'move'。设置成 true 为都开启
                    label: {//文本设置(Echarts其他图表都有这样的设置,值得多看)
                        normal: {//文字颜色
                            show: true,//是否显示文字
                            color: '#eee'
                        },
                        emphasis: {//hover各省时的文字颜色
                            show: false,
                            color: '#eee'
                        }
                    },
                    itemStyle: {
                        normal: {
                            areaColor: '#416cbb',//地图区域的颜色。
                            borderColor: '#fff',//图形的描边颜色。支持的颜色格式同 color,不支持回调函数。
                            shadowColor: '#41587f',//阴影颜色。
                            shadowBlur: 10,//图形阴影的模糊大小。
                            opacity: 0.75//图形透明度

                        },
                        emphasis: {
                            areaColor: '#fdd145'
                        }
                    }
                },
                series: [
                    {
                        name: '苹果',
                        type: 'map',
                        mapType: 'china',
                        geoIndex: 0,//理解就是多个组件都能用option里配置的geo地图,类似于坐标轴里的yAxisIndex:numder,也就是说你可以配置多个geo,也可以多个组件共用geo
                        label: {
                            normal: {
                                show: true
                            },
                            emphasis: {
                                show: true
                            }
                        },
                        data: seriesData,
                        tooltip: {
                          // 利用formatter来自定义tooltip展示的数据
                            formatter: function (params,ticket,callback) {
                                if (params.value) {
                                    return params.name+'<br/>成交量:' + params.value + '单<br/>' + '平均标签价格:' + params.data.price + '元<br/>' + '商品数量:' + params.data.amount+'家'
                                } else {
                                    callback()
                                }
                            }
                        }
                    }
                ]
            };
            var myChart = echarts.init(document.getElementById('map'), 'dark');
            myChart.setOption(option);
  });


</script>
</html>