Annotation标注
主要解决如何在图像中添加注解
添加点和垂直线
#添加(x0,y0),大小为50,颜色为red
plt.scatter(x0,y0,s=50,color='r')
#黑色虚线(k--)宽度1.5(lw=1.5)绘制垂直线
plt.plot([x0,x0],[0,y0],'k--',lw=1.5)
添加标注
给一个点添加标注
方法
plt.annotate(str,xy=,xycoords=,xytext=,textcoords=,fontsize=,arrowprops=dict(arrowstyle=,connectionstyle=))
示例
plt.annotate(r'$2x=%s$'%y0,xy=(x0,y0),xycoords='data',xytext=(+30,-30),textcoords='offset points',fontsize=16,arrowprops=dict(arrowstyle='->',connectionstyle='arc3,rad=0.2'))
相应参数
- str,标注内容
xy:元组,代表被标注点的坐标xycoords:字符串,被注释点的坐标系属性。默认为'data',即以被注释的坐标点xy为参考textcoords:字符串
xycoordsandtextcoords是坐标xy与xytext的说明,若textcoords=None,则默认textcoords与xycoords相同,若都未设置,默认为'data'
上述示例中,xy(箭头尖端)和xytext位置(文本位置)都以数据坐标为单位。 有多种可以选择的其他坐标系 , 你可以使用xycoords和textcoords以及下列字符串之一(默认为data)指定xy和xytext的坐标系。
| 参数 | 坐标系 | |
|---|---|---|
| 1 | 'figure points' | 距离图形左下角的点数量 |
| 2 | 'figure pixels' | 距离图形左下角的点数量 |
| 3 | 'figure fraction' | 0,0 是图形左下角,1,1 是右上角 |
| 4 | 'axes points' | 距离轴域左下角的点数量 |
| 5 | 'axes pixels' | 距离轴域左下角的像素数量 |
| 6 | 'axes fraction' | 0,0 是轴域左下角,1,1 是右上角 |
| 7 | 'data' | 使用轴域数据坐标系 |
xytext:元组,代表标注内容相对被标注点的坐标fontsize:标注内容的大小arrowprops-
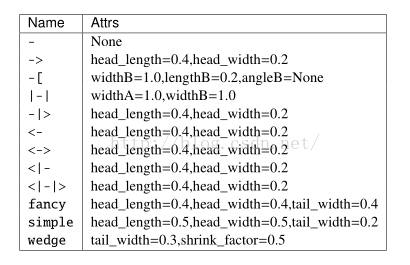
arrowstyle:字符串,箭头形状

-
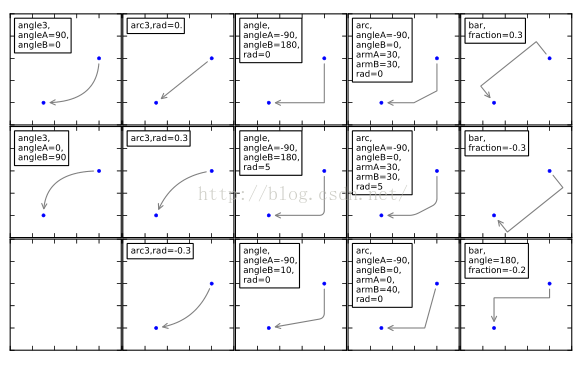
connectionstyle:字符串,箭头弧度
可选参数

相应效果

-
text(x,y,str,fontdict)
示例
plt.text(-3.7,3,r'$This is a text mu sigma_i alpha_t$',fontdict={'size':16,'color':'r'})
参数说明
x:int or float注释内容所在位置横坐标y:int or float注释内容所在位置纵坐标str:str,注释内容fontdict,dict'size':注释内容大小'color':注释内容颜色
总代码及运行结果
代码
import matplotlib.pyplot as plt
import numpy as np
x = np.linspace(-3,3,500)
y = 2*x
plt.plot(x,y)
#1、设置x,y轴的范围
plt.xlim((-1,6))
plt.ylim((-6,6))
#2、设置x,y轴的标签
plt.xlabel("x")
plt.ylabel("y")
#3、设置坐标轴的单位长度
new_ticks = np.linspace(-3,3,7)  #范围从-3到3,划分为6段
plt.xticks(new_ticks)
#4、自定义value,并更改标签的字体(使用latex语法,注意空格使用转义)
plt.yticks([-6,-2,0,2,6],[r'$very bad$',r'$plain$',r'$very good$',r'$alpha$'])
#5、隐藏上轴和右轴
ax = plt.gca()
ax.spines['right'].set_color('none')
ax.spines['top'].set_color('none')
#6、设置x轴为下面的轴,设置y轴为左边的轴
ax.xaxis.set_ticks_position('bottom')
ax.yaxis.set_ticks_position('left')
#7、设置原点的坐标
ax.spines['bottom'].set_position(('data',0))#x轴表示为y=0
ax.spines['left'].set_position(('data',1))  #y轴表示为x=1
#8、添加Annotation
## 8.1 添加点和垂直线
x0 = 2
y0 = 2*x0
#绘制对应点
plt.scatter(x0,y0,s=50,color='r')
#黑色虚线宽度1.5绘制垂直线
plt.plot([x0,x0],[0,y0],'k--',lw=1.5)

## 8.2 添加标注
plt.annotate(r'$2x=4$',xy=(x0,y0),xycoords='data',xytext=(+30,-30),textcoords='offset points',fontsize=30,arrowprops=dict(arrowstyle='->',connectionstyle='arc3,rad=.2'))
plt.text(-3.7,3,r'$This is a text mu sigma_i alpha_t$',fontdict={'size':16,'color':'r'})
plt.show()
运行结果

备注:部分图片来自该博客,仅供学习交流使用,侵删。
Matplotlib中文指南——标注